Oliver Wolcott Technical High School, located in 75 Oliver St. Torrington , CT 06790-3859, serves 633 students with a student/teacher ratio of 11.3. It belongs to Connecticut Technical Education and Career System and ranks 101st of 139 Connecticut High Schools.
School District
District: Connecticut Technical Education and Career System
Number of students:
633
Public School Search
Rank:
101st
101st of 139 Connecticut High Schools
Per Pupil Expenditure
$
Student/Teacher Ratio
Student/Teacher Ratio
11.3
Racial Breakdown
White:
79%
Hispanic:
14.8%
Two or more races:
3.6%
African American:
2.1%
Asian:
0.2%
American Indian:
0.2%
Pacific Islander:
0.2%
Free/Discounted lunch recipients
Free/Discounted lunch recipients
45.3%
Performance Trends
Statewide Performance
Average Standard Score
Test Score Average
Average Standard Score
Student Body
Enrollment
Average Standard Score
% Free/Reduced Lunch
Immunization % Complete (Kindergarten)
Teachers
Student/Teacher Ratio
# Full-Time Teachers
Finance
Per Pupil Expenditures
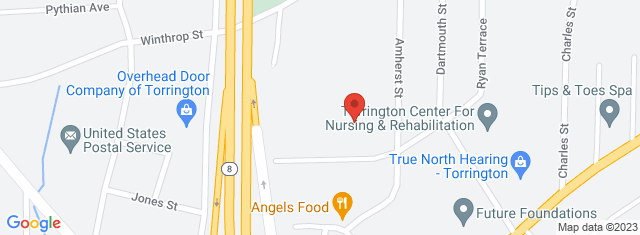
Map and Boundary of Oliver Wolcott Technical High School
School Ranking in Connecticut
PublicSchoolSearch ranks 101st of 139 Connecticut High Schools.
District Ranking in State
PublicSchoolSearch ranks 101st of 139 Connecticut High Schools.
Average Parent Rating
Historical Ranking of Oliver Wolcott Technical High School to other
Connecticut Elementary Schools
Statewide Rank Position Percentile
Oliver Wolcott Technical High School Test Scores
Historical Enrollment Data
Concerd International School
Impact of COVID-19 on Oliver Wolcott Technical High School
Test Scores
% proficient Pre-pandemic (2018-2019)
% proficient Pandemic (2020-2021)
% proficient Post-pandemic (2021-2022)
Change (%)
11th Grade Math (Oliver Wolcott Technical High School)
13.9
12
1.9%
11th Grade Math (Connecticut Technical Education and Career System)
12.1
9.7
2.4%
11th Grade Math (Connecticut)
40.6
34.8
5.8%
Student Body
Number of Students Pre-pandemic (2018-2019)
Number of Students Pandemic (2020-2021)
Number of Students Post-pandemic (2021-2022)
Change (%)
Total Students
637
633
0.6%
African American
12
13
8.3%
American Indian
0
1
0%
Asian
3
1
66.7%
Hispanic
73
94
28.8%
Pacific Islander
2
1
50%
White
524
500
4.6%
Two or More Races
23
23
0%
Free/Discounted Lunch Recipients
43.2
45.3
2.2%
Compare Oliver Wolcott Technical High School to Nearby Schools
School
Students/Teacher
School
Education Period
Address
District
Number of Students
Student\ Teacher Ratio
Free / discounted lunch recipients %
Connecticut School District Rankings
School Disctrict
Education Period
City
County
Elemen-tary Schools
Middle Schools
Hight Schools
District Ranking in State
Statewide Rank Position Percentile (As Elementary School)
Statewide Rank Position Percentile (As Middle School)
Statewide Rank Position Percentile (As High School)