Education Period
Public K-8
Address
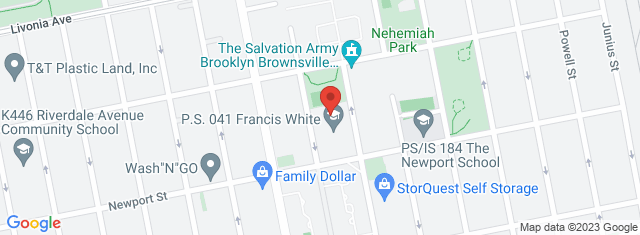
411 Thatford Ave Brooklyn , NY 11212-5898
Overview
Ps 41 Francis White, located in 411 Thatford Ave Brooklyn , NY 11212-5898, serves 291 students with a student/teacher ratio of 10.3. It belongs to New York City Geographic District #23 and ranks 2348th of 2,434 New York Elementary Schools.
School District
District: New York City Geographic District #23
Number of students:
291
Public School Search
Rank:
2348th
2348th of 2,434 New York Elementary Schools
Per Pupil Expenditure
$24,172
| Student/Teacher Ratio | |
|---|---|
| Student/Teacher Ratio | 10.3 |
| Immunization | |
|---|---|
| Fully immunized: | 97.5% |
| Racial Breakdown | |
|---|---|
| African American: | 59.1% |
| Hispanic: | 31.3% |
| Two or more races: | 4.5% |
| American Indian: | 3.1% |
| White: | 1.4% |
| Asian: | 0.3% |
| Pacific Islander: | 0.3% |
| Free/Discounted lunch recipients | |
|---|---|
| Free/Discounted lunch recipients | 96.2% |
Performance Trends
Statewide Performance
Average Standard Score
Test Score Average
Average Standard Score
Student Body
Enrollment
Average Standard Score
% Free/Reduced Lunch
Immunization % Complete (Kindergarten)
Teachers
Student/Teacher Ratio
# Full-Time Teachers
Finance
Per Pupil Expenditures
Map and Boundary of Ps 41 Francis White
School Ranking in New York
PublicSchoolSearch ranks 2348th of 2,434 New York Elementary Schools.
District Ranking in State
PublicSchoolSearch ranks 2348th of 2,434 New York Elementary Schools.
Average Parent Rating
Historical Ranking of Ps 41 Francis White to other New York Elementary Schools
Statewide Rank Position Percentile
Impact of COVID-19 on Ps 41 Francis White
Rankings
|
Rank Pre-pandemic (2018-2019) |
Rank Pandemic (2020-2021) |
Rank Post-pandemic (2018-2019) |
Change (%) |
|---|---|---|---|
| Ranks 2132nd of 2413 Elementary schools | Ranks 2348th of 2434 Elementary schools | 8.1% | |
| Ranks 1234th of 1439 Middle schools | Ranks 1133rd of 1479 Middle schools | 9.1% |
Test Scores
|
% proficient Pre-pandemic (2018-2019) |
% proficient Pandemic (2020-2021) | % proficient Post-pandemic (2021-2022) | Change (%) | |
|---|---|---|---|---|
| 3rd Grade English Language Arts (Ps 41 Francis White) | 30 | 0 |
30% | |
| 3rd Grade English Language Arts (New York City Geographic District #23) | 32 | 26.1 |
5.9% | |
| 3rd Grade English Language Arts (New York) | 52 | 46.3 |
5.7% | |
| 3rd Grade Math (Ps 41 Francis White) | 15 | 5 |
10% | |
| 3rd Grade Math (New York City Geographic District #23) | 28 | 25.1 |
3% | |
| 3rd Grade Math (New York) | 54 | 47.7 |
6.3% | |
| 4th Grade English Language Arts (Ps 41 Francis White) | 12 | 4.2 |
7.8% | |
| 4th Grade English Language Arts (New York City Geographic District #23) | 26 | 24.3 |
1.7% | |
| 4th Grade English Language Arts (New York) | 48 | 41.5 |
6.5% | |
| 4th Grade Math (Ps 41 Francis White) | 19 | 0 |
19% | |
| 4th Grade Math (New York City Geographic District #23) | 24 | 18.3 |
5.7% | |
| 4th Grade Math (New York) | 50 | 42.9 |
7.1% | |
| 5th Grade English Language Arts (Ps 41 Francis White) | 24 | 8.7 |
15.3% | |
| 5th Grade English Language Arts (New York City Geographic District #23) | 23 | 16.4 |
6.6% | |
| 5th Grade English Language Arts (New York) | 38 | 37.7 |
0.3% | |
| 6th Grade English Language Arts (Ps 41 Francis White) | 23 | 44.4 |
21.4% | |
| 6th Grade English Language Arts (New York City Geographic District #23) | 24 | 39.3 |
15.3% | |
| 6th Grade English Language Arts (New York) | 47 | 56.6 |
9.6% | |
| 6th Grade Math (Ps 41 Francis White) | 31 | 7.4 |
23.6% | |
| 6th Grade Math (New York City Geographic District #23) | 23 | 12.8 |
10.2% | |
| 6th Grade Math (New York) | 47 | 38.3 |
8.7% | |
| 7th Grade English Language Arts (Ps 41 Francis White) | 18 | 25 |
7% | |
| 7th Grade English Language Arts (New York City Geographic District #23) | 20 | 34.3 |
14.3% | |
| 7th Grade English Language Arts (New York) | 40 | 48 |
8% | |
| 7th Grade Math (Ps 41 Francis White) | 13 | 9.1 |
3.9% | |
| 7th Grade Math (New York City Geographic District #23) | 24 | 17.5 |
6.5% | |
| 7th Grade Math (New York) | 44 | 35.3 |
8.7% | |
| 8th Grade English Language Arts (Ps 41 Francis White) | 24 | 43.2 |
19.2% | |
| 8th Grade English Language Arts (New York City Geographic District #23) | 34 | 39.2 |
5.2% | |
| 8th Grade English Language Arts (New York) | 48 | 49.8 |
1.8% | |
| 8th Grade Math (Ps 41 Francis White) | 19 | 24.3 |
5.3% | |
| 8th Grade Math (New York City Geographic District #23) | 19 | 13.8 |
5.2% | |
| 8th Grade Math (New York) | 33 | 23.8 |
9.2% |
Student Body
|
Number of Students Pre-pandemic (2018-2019) |
Number of Students Pandemic (2020-2021) |
Number of Students Post-pandemic (2021-2022) |
Change (%) | |
|---|---|---|---|---|
| Total Students | 400 | 291 |
27.3% |
|
| African American | 236 | 172 |
27.1% |
|
| American Indian | 8 | 9 |
12.5% |
|
| Asian | 2 | 1 |
50% |
|
| Hispanic | 135 | 91 |
32.6% |
|
| Pacific Islander | 1 | 1 | 0% | |
| White | 7 | 4 |
42.9% |
|
| Two or More Races | 11 | 13 |
18.2% |
|
| Free/Discounted Lunch Recipients | 96.8 | 96.2 |
0.5% |