Riverview Elementary School, located in 55 Taylor Dr Tonawanda , NY 14150-5927, serves 282 students with a student/teacher ratio of 12.5. It belongs to Tonawanda City School District and ranks 1495th of 2,434 New York Elementary Schools.
School District
District: Tonawanda City School District
Number of students:
282
Public School Search
Rank:
1495th
1495th of 2,434 New York Elementary Schools
Per Pupil Expenditure
$11,533
Student/Teacher Ratio
Student/Teacher Ratio
12.5
Immunization
Fully immunized:
99.3%
Measles:
100%
Polio:
99.6%
Measles:
100%
Diphtheria:
99.6%
Hepatitis B:
100%
Varicella:
99.6%
Racial Breakdown
White:
80.9%
Hispanic:
7.4%
Two or more races:
6%
Asian:
3.2%
African American:
2.5%
Free/Discounted lunch recipients
Free/Discounted lunch recipients
55.7%
Performance Trends
Statewide Performance
Average Standard Score
Test Score Average
Average Standard Score
Student Body
Enrollment
Average Standard Score
% Free/Reduced Lunch
Immunization % Complete (Kindergarten)
Teachers
Student/Teacher Ratio
# Full-Time Teachers
Finance
Per Pupil Expenditures
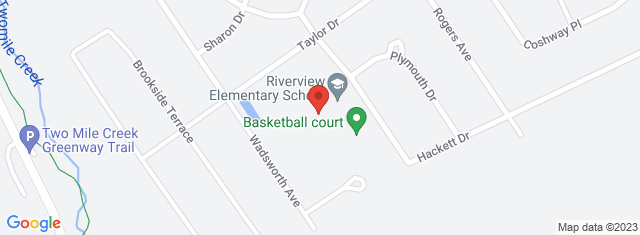
Map and Boundary of Riverview Elementary School
School Ranking in New York
PublicSchoolSearch ranks 1495th of 2,434 New York Elementary Schools.
District Ranking in State
PublicSchoolSearch ranks 1495th of 2,434 New York Elementary Schools.
Average Parent Rating
Historical Ranking of Riverview Elementary School to other
New York Elementary Schools
Statewide Rank Position Percentile
Riverview Elementary School Test Scores
Historical Enrollment Data
Concerd International School
Impact of COVID-19 on Riverview Elementary School
Test Scores
% proficient Pre-pandemic (2018-2019)
% proficient Pandemic (2020-2021)
% proficient Post-pandemic (2021-2022)
Change (%)
3rd Grade English Language Arts (Riverview Elementary School)
35
35.5
0.5%
3rd Grade English Language Arts (Tonawanda City School District)
38
31.8
6.3%
3rd Grade English Language Arts (New York)
52
46.3
5.7%
3rd Grade Math (Riverview Elementary School)
56
38.7
17.3%
3rd Grade Math (Tonawanda City School District)
52
36
16%
3rd Grade Math (New York)
54
47.7
6.3%
Student Body
Number of Students Pre-pandemic (2018-2019)
Number of Students Pandemic (2020-2021)
Number of Students Post-pandemic (2021-2022)
Change (%)
Total Students
321
282
12.1%
African American
3
7
133.3%
American Indian
0
0
0%
Asian
4
9
125%
Hispanic
24
21
12.5%
Pacific Islander
0
0
0%
White
278
228
18%
Two or More Races
12
17
41.7%
Free/Discounted Lunch Recipients
48
55.7
7.7%
Compare Riverview Elementary School to Nearby Schools
School
Students/Teacher
School
Education Period
Address
District
Number of Students
Student\ Teacher Ratio
Free / discounted lunch recipients %
New York School District Rankings
School Disctrict
Education Period
City
County
Elemen-tary Schools
Middle Schools
Hight Schools
District Ranking in State
Statewide Rank Position Percentile (As Elementary School)
Statewide Rank Position Percentile (As Middle School)
Statewide Rank Position Percentile (As High School)