Charles A Lindbergh Elementary School, located in 184 Irving Ter Buffalo , NY 14223-2317, serves 461 students with a student/teacher ratio of 10.9. It belongs to Kenmore-Tonawanda Union Free School District and ranks 890th of 2,434 New York Elementary Schools.
School District
District: Kenmore-Tonawanda Union Free School District
Number of students:
461
Public School Search
Rank:
890th
890th of 2,434 New York Elementary Schools
Per Pupil Expenditure
$16,959
Student/Teacher Ratio
Student/Teacher Ratio
10.9
Immunization
Fully immunized:
99.4%
Measles:
99.4%
Polio:
99.6%
Measles:
99.4%
Diphtheria:
99.6%
Hepatitis B:
99.6%
Varicella:
99.4%
Racial Breakdown
White:
76.8%
Hispanic:
10.2%
Two or more races:
6.1%
Asian:
3.7%
African American:
3%
American Indian:
0.2%
Free/Discounted lunch recipients
Free/Discounted lunch recipients
37.1%
Performance Trends
Statewide Performance
Average Standard Score
Test Score Average
Average Standard Score
Student Body
Enrollment
Average Standard Score
% Free/Reduced Lunch
Immunization % Complete (Kindergarten)
Teachers
Student/Teacher Ratio
# Full-Time Teachers
Finance
Per Pupil Expenditures
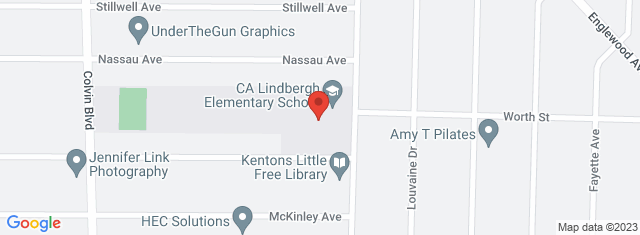
Map and Boundary of Charles A Lindbergh Elementary School
School Ranking in New York
PublicSchoolSearch ranks 890th of 2,434 New York Elementary Schools.
District Ranking in State
PublicSchoolSearch ranks 890th of 2,434 New York Elementary Schools.
Average Parent Rating
Historical Ranking of Charles A Lindbergh Elementary School to other
New York Elementary Schools
Statewide Rank Position Percentile
Charles A Lindbergh Elementary School Test Scores
Historical Enrollment Data
Concerd International School
Impact of COVID-19 on Charles A Lindbergh Elementary School
Rankings
Rank Pre-pandemic (2018-2019)
Rank Pandemic (2020-2021)
Rank Post-pandemic (2018-2019)
Change (%)
Ranks 813th of 2413 Elementary schools
Ranks 890th of 2434 Elementary schools
2.9%
Test Scores
% proficient Pre-pandemic (2018-2019)
% proficient Pandemic (2020-2021)
% proficient Post-pandemic (2021-2022)
Change (%)
3rd Grade English Language Arts (Charles A Lindbergh Elementary School)
51
53.6
2.6%
3rd Grade English Language Arts (Kenmore-Tonawanda Union Free School District)
42
33.1
8.9%
3rd Grade English Language Arts (New York)
52
46.3
5.7%
3rd Grade Math (Charles A Lindbergh Elementary School)
66
65.5
0.5%
3rd Grade Math (Kenmore-Tonawanda Union Free School District)
57
36.2
20.8%
3rd Grade Math (New York)
54
47.7
6.3%
4th Grade English Language Arts (Charles A Lindbergh Elementary School)
55
40
15%
4th Grade English Language Arts (Kenmore-Tonawanda Union Free School District)
35
32.9
2.2%
4th Grade English Language Arts (New York)
48
41.5
6.5%
4th Grade Math (Charles A Lindbergh Elementary School)
64
42
22%
4th Grade Math (Kenmore-Tonawanda Union Free School District)
42
29.8
12.2%
4th Grade Math (New York)
50
42.9
7.1%
Student Body
Number of Students Pre-pandemic (2018-2019)
Number of Students Pandemic (2020-2021)
Number of Students Post-pandemic (2021-2022)
Change (%)
Total Students
503
461
8.3%
African American
19
14
26.3%
American Indian
1
1
0%
Asian
17
17
0%
Hispanic
43
47
9.3%
Pacific Islander
0
0
0%
White
389
354
9%
Two or More Races
34
28
17.6%
Free/Discounted Lunch Recipients
40.4
37.1
3.3%
Compare Charles A Lindbergh Elementary School to Nearby Schools
School
Students/Teacher
School
Education Period
Address
District
Number of Students
Student\ Teacher Ratio
Free / discounted lunch recipients %
New York School District Rankings
School Disctrict
Education Period
City
County
Elemen-tary Schools
Middle Schools
Hight Schools
District Ranking in State
Statewide Rank Position Percentile (As Elementary School)
Statewide Rank Position Percentile (As Middle School)
Statewide Rank Position Percentile (As High School)