State College Area High School, located in 650 Westerly Pkwy State College , PA 16801-4225, serves 2,370 students with a student/teacher ratio of 11.9. It belongs to State College Area School District and ranks 12th of 537 Pennsylvania High Schools.
School District
District: State College Area School District
Number of students:
2370
Public School Search
Rank:
12th
12th of 537 Pennsylvania High Schools
Per Pupil Expenditure
$19,619
Student/Teacher Ratio
Student/Teacher Ratio
11.9
Racial Breakdown
White:
78.5%
Asian:
7.8%
Two or more races:
6.4%
Hispanic:
4.1%
African American:
3%
American Indian:
0.1%
Pacific Islander:
0%
Free/Discounted lunch recipients
Free/Discounted lunch recipients
17.6%
Performance Trends
Statewide Performance
Average Standard Score
Test Score Average
Average Standard Score
Student Body
Enrollment
Average Standard Score
% Free/Reduced Lunch
Immunization % Complete (Kindergarten)
Teachers
Student/Teacher Ratio
# Full-Time Teachers
Finance
Per Pupil Expenditures
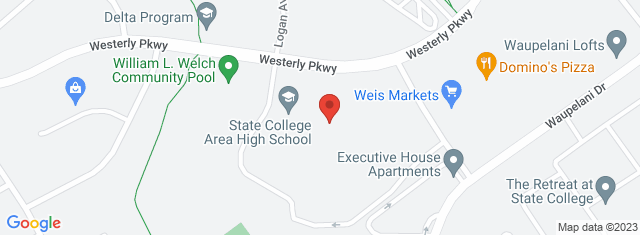
Map and Boundary of State College Area High School
School Ranking in Pennsylvania
PublicSchoolSearch ranks 12th of 537 Pennsylvania High Schools.
District Ranking in State
PublicSchoolSearch ranks 12th of 537 Pennsylvania High Schools.
Average Parent Rating
Historical Ranking of State College Area High School to other
Pennsylvania Elementary Schools
Statewide Rank Position Percentile
State College Area High School Test Scores
Historical Enrollment Data
Concerd International School
Impact of COVID-19 on State College Area High School
Rankings
Rank Pre-pandemic (2018-2019)
Rank Pandemic (2020-2021)
Rank Post-pandemic (2018-2019)
Change (%)
Ranks 93rd of 693 High schools
Ranks 12th of 537 High schools
11.2%
Test Scores
% proficient Pre-pandemic (2018-2019)
% proficient Pandemic (2020-2021)
% proficient Post-pandemic (2021-2022)
Change (%)
11th Grade Algebra I (State College Area High School)
80.7
9.9%
11th Grade Algebra I (Pennsylvania)
63.3
0.9%
11th Grade Biology (State College Area High School)
81.6
14.4%
11th Grade Biology (Pennsylvania)
63.2
4.4%
Student Body
Number of Students Pre-pandemic (2018-2019)
Number of Students Pandemic (2020-2021)
Number of Students Post-pandemic (2021-2022)
Change (%)
Total Students
2344
2370
1.1%
African American
74
70
5.4%
American Indian
7
3
57.1%
Asian
179
185
3.4%
Hispanic
94
98
4.3%
Pacific Islander
1
1
0%
White
1876
1861
0.8%
Two or More Races
113
152
34.5%
Free/Discounted Lunch Recipients
21.7
17.6
4.1%
Compare State College Area High School to Nearby Schools
School
Students/Teacher
School
Education Period
Address
District
Number of Students
Student\ Teacher Ratio
Free / discounted lunch recipients %
Pennsylvania School District Rankings
School Disctrict
Education Period
City
County
Elemen-tary Schools
Middle Schools
Hight Schools
District Ranking in State
Statewide Rank Position Percentile (As Elementary School)
Statewide Rank Position Percentile (As Middle School)
Statewide Rank Position Percentile (As High School)