Intermediate School, located in 600 Governor Dr Shillington , PA 19607-2952, serves 626 students with a student/teacher ratio of 14.2. It belongs to Governor Mifflin School District.
School District
District: Governor Mifflin School District
Number of students:
626
Public School Search
Rank:
Per Pupil Expenditure
$14,971
Student/Teacher Ratio
Student/Teacher Ratio
14.2
Racial Breakdown
White:
58.6%
Hispanic:
31.8%
Two or more races:
4.6%
African American:
3.5%
Asian:
1.4%
Free/Discounted lunch recipients
Free/Discounted lunch recipients
48.7%
Performance Trends
Statewide Performance
Average Standard Score
Test Score Average
Average Standard Score
Student Body
Enrollment
Average Standard Score
% Free/Reduced Lunch
Immunization % Complete (Kindergarten)
Teachers
Student/Teacher Ratio
# Full-Time Teachers
Finance
Per Pupil Expenditures
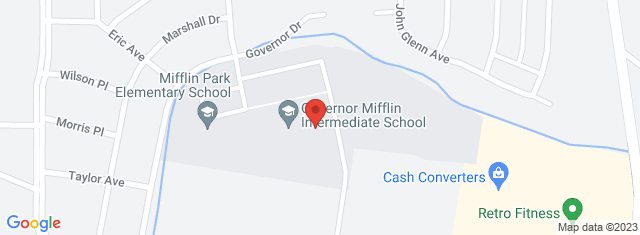
Map and Boundary of Intermediate School
School Ranking in Pennsylvania
District Ranking in State
Average Parent Rating
Historical Ranking of Intermediate School to other
Pennsylvania Elementary Schools
Statewide Rank Position Percentile
Intermediate School Test Scores
Historical Enrollment Data
Concerd International School
Impact of COVID-19 on Intermediate School
Test Scores
% proficient Pre-pandemic (2018-2019)
% proficient Pandemic (2020-2021)
% proficient Post-pandemic (2021-2022)
Change (%)
5th Grade Math (Intermediate School)
42.3
13.4%
5th Grade Math (Pennsylvania)
43
6.9%
5th Grade English Language Arts (Intermediate School)
56
14.9%
5th Grade English Language Arts (Pennsylvania)
58.5
3.5%
6th Grade Math (Intermediate School)
53
28.9%
6th Grade Math (Pennsylvania)
39
10.8%
6th Grade English Language Arts (Intermediate School)
69.6
25.8%
6th Grade English Language Arts (Pennsylvania)
63
5.7%
All Grades Math (Intermediate School)
48.3
21.9%
All Grades English Language Arts (Intermediate School)
63.5
20.9%
Student Body
Number of Students Pre-pandemic (2018-2019)
Number of Students Pandemic (2020-2021)
Number of Students Post-pandemic (2021-2022)
Change (%)
Total Students
655
626
4.4%
African American
29
22
24.1%
American Indian
0
0
0%
Asian
10
9
10%
Hispanic
170
199
17.1%
Pacific Islander
0
0
0%
White
419
367
12.4%
Two or More Races
27
29
7.4%
Free/Discounted Lunch Recipients
48.9
48.7
0.1%
Compare Intermediate School to Nearby Schools
School
Students/Teacher
School
Education Period
Address
District
Number of Students
Student\ Teacher Ratio
Free / discounted lunch recipients %
Pennsylvania School District Rankings
School Disctrict
Education Period
City
County
Elemen-tary Schools
Middle Schools
Hight Schools
District Ranking in State
Statewide Rank Position Percentile (As Elementary School)
Statewide Rank Position Percentile (As Middle School)
Statewide Rank Position Percentile (As High School)