Education Period
Public, Charter PK, KG-8
Address
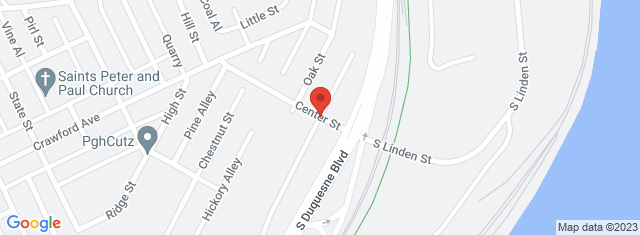
10 Center Street Pittsburgh , PA 15132
Overview
Young Scholars of Greater Allegheny Charter School, located in 10 Center Street Pittsburgh , PA 15132, serves 301 students with a student/teacher ratio of 13.6. It belongs to Young Scholars of Greater Allegheny Charter School and ranks 1234th of 1,433 Pennsylvania Elementary Schools.
School District
District: Young Scholars of Greater Allegheny Charter School
Number of students:
301
Public School Search
Rank:
1234th
1234th of 1,433 Pennsylvania Elementary Schools
Per Pupil Expenditure
$13,763
| Student/Teacher Ratio | |
|---|---|
| Student/Teacher Ratio | 13.6 |
| Racial Breakdown | |
|---|---|
| African American: | 79.4% |
| Two or more races: | 8.6% |
| White: | 7.6% |
| Hispanic: | 4.3% |
| Free/Discounted lunch recipients | |
|---|---|
| Free/Discounted lunch recipients | 100% |
Performance Trends
Statewide Performance
Average Standard Score
Test Score Average
Average Standard Score
Student Body
Enrollment
Average Standard Score
% Free/Reduced Lunch
Immunization % Complete (Kindergarten)
Teachers
Student/Teacher Ratio
# Full-Time Teachers
Finance
Per Pupil Expenditures
Map and Boundary of Young Scholars of Greater Allegheny Charter School
School Ranking in Pennsylvania
PublicSchoolSearch ranks 1234th of 1,433 Pennsylvania Elementary Schools.
District Ranking in State
PublicSchoolSearch ranks 1234th of 1,433 Pennsylvania Elementary Schools.
Average Parent Rating
Historical Ranking of Young Scholars of Greater Allegheny Charter School to other Pennsylvania Elementary Schools
Statewide Rank Position Percentile
Impact of COVID-19 on Young Scholars of Greater Allegheny Charter School
Rankings
|
Rank Pre-pandemic (2018-2019) |
Rank Pandemic (2020-2021) |
Rank Post-pandemic (2018-2019) |
Change (%) |
|---|---|---|---|
| Ranks 1141st of 1544 Elementary schools | Ranks 1234th of 1433 Elementary schools | 12.2% | |
| Ranks 515th of 891 Middle schools | Ranks 601st of 797 Middle schools | 17.6% |
Test Scores
|
% proficient Pre-pandemic (2018-2019) |
% proficient Pandemic (2020-2021) | % proficient Post-pandemic (2021-2022) | Change (%) | |
|---|---|---|---|---|
| 3rd Grade Math (Young Scholars of Greater Allegheny Charter School) | 50 |
50% | ||
| 3rd Grade Math (Pennsylvania) | 56 |
8.7% | ||
| 3rd Grade English Language Arts (Young Scholars of Greater Allegheny Charter School) | 44.4 |
18.5% | ||
| 3rd Grade English Language Arts (Pennsylvania) | 61.9 |
3.6% | ||
| 4th Grade Math (Young Scholars of Greater Allegheny Charter School) | 35.7 |
28.3% | ||
| 4th Grade Math (Pennsylvania) | 46.2 |
10.7% | ||
| 4th Grade Science (Young Scholars of Greater Allegheny Charter School) | 71.5 |
19.5% | ||
| 4th Grade Science (Pennsylvania) | 77.8 |
2% | ||
| 4th Grade English Language Arts (Young Scholars of Greater Allegheny Charter School) | 50 |
24.1% | ||
| 4th Grade English Language Arts (Pennsylvania) | 63.6 |
7% | ||
| 5th Grade Math (Young Scholars of Greater Allegheny Charter School) | 16.7 |
6.2% | ||
| 5th Grade Math (Pennsylvania) | 43 |
6.9% | ||
| 5th Grade English Language Arts (Young Scholars of Greater Allegheny Charter School) | 55.6 |
27.8% | ||
| 5th Grade English Language Arts (Pennsylvania) | 58.5 |
3.5% | ||
| 6th Grade Math (Young Scholars of Greater Allegheny Charter School) | 7.7 |
1.4% | ||
| 6th Grade Math (Pennsylvania) | 39 |
10.8% | ||
| 6th Grade English Language Arts (Young Scholars of Greater Allegheny Charter School) | 61.6 |
21.6% | ||
| 6th Grade English Language Arts (Pennsylvania) | 63 |
5.7% | ||
| 7th Grade Math (Young Scholars of Greater Allegheny Charter School) | 38.5 |
28% | ||
| 7th Grade Math (Pennsylvania) | 38.2 |
11.3% | ||
| 7th Grade English Language Arts (Young Scholars of Greater Allegheny Charter School) | 61.5 |
24.7% | ||
| 7th Grade English Language Arts (Pennsylvania) | 60.5 |
7.2% | ||
| All Grades Math (Young Scholars of Greater Allegheny Charter School) | 30.3 |
23.6% | ||
| All Grades Science (Young Scholars of Greater Allegheny Charter School) | 71.5 |
26.3% | ||
| All Grades English Language Arts (Young Scholars of Greater Allegheny Charter School) | 53.9 |
22.6% |
Student Body
|
Number of Students Pre-pandemic (2018-2019) |
Number of Students Pandemic (2020-2021) |
Number of Students Post-pandemic (2021-2022) |
Change (%) | |
|---|---|---|---|---|
| Total Students | 211 | 301 |
42.7% |
|
| African American | 176 | 239 |
35.8% |
|
| American Indian | 0 | 0 | 0% | |
| Asian | 0 | 0 | 0% | |
| Hispanic | 7 | 13 |
85.7% |
|
| Pacific Islander | 0 | 0 | 0% | |
| White | 23 | 23 | 0% | |
| Two or More Races | 5 | 26 |
420% |
|
| Free/Discounted Lunch Recipients | 99.5 | 100 |
0.5% |