William Prescott #38, located in Prescott Avenue & Myrtle St Scranton , PA 18510, serves 286 students with a student/teacher ratio of 13.8. It belongs to Scranton School District.
School District
District: Scranton School District
Number of students:
286
Public School Search
Rank:
Per Pupil Expenditure
$14,667
Student/Teacher Ratio
Student/Teacher Ratio
13.8
Racial Breakdown
White:
38.1%
Hispanic:
22.7%
Asian:
17.1%
African American:
14.7%
Two or more races:
6.6%
American Indian:
0.3%
Pacific Islander:
0.3%
Free/Discounted lunch recipients
Free/Discounted lunch recipients
99%
Performance Trends
Statewide Performance
Average Standard Score
Test Score Average
Average Standard Score
Student Body
Enrollment
Average Standard Score
% Free/Reduced Lunch
Immunization % Complete (Kindergarten)
Teachers
Student/Teacher Ratio
# Full-Time Teachers
Finance
Per Pupil Expenditures
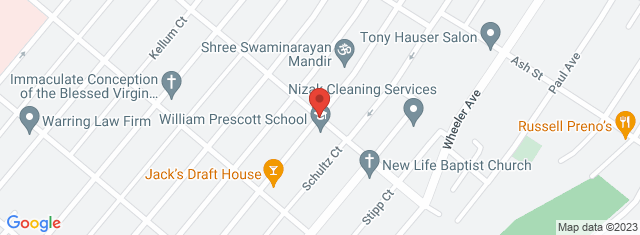
Map and Boundary of William Prescott #38
School Ranking in Pennsylvania
District Ranking in State
Average Parent Rating
Historical Ranking of William Prescott #38 to other
Pennsylvania Elementary Schools
Statewide Rank Position Percentile
William Prescott #38 Test Scores
Historical Enrollment Data
Concerd International School
Impact of COVID-19 on William Prescott #38
Test Scores
% proficient Pre-pandemic (2018-2019)
% proficient Pandemic (2020-2021)
% proficient Post-pandemic (2021-2022)
Change (%)
5th Grade Math (William Prescott #38)
43.5
22.4%
5th Grade Math (Pennsylvania)
43
6.9%
5th Grade English Language Arts (William Prescott #38)
57.8
15.7%
5th Grade English Language Arts (Pennsylvania)
58.5
3.5%
All Grades Math (William Prescott #38)
48.5
22.1%
All Grades English Language Arts (William Prescott #38)
60.9
15.2%
Student Body
Number of Students Pre-pandemic (2018-2019)
Number of Students Pandemic (2020-2021)
Number of Students Post-pandemic (2021-2022)
Change (%)
Total Students
331
286
13.6%
African American
43
42
2.3%
American Indian
0
1
0%
Asian
41
49
19.5%
Hispanic
52
65
25%
Pacific Islander
5
1
80%
White
165
109
33.9%
Two or More Races
25
19
24%
Free/Discounted Lunch Recipients
100
99
1%
Compare William Prescott #38 to Nearby Schools
School
Students/Teacher
School
Education Period
Address
District
Number of Students
Student\ Teacher Ratio
Free / discounted lunch recipients %
Pennsylvania School District Rankings
School Disctrict
Education Period
City
County
Elemen-tary Schools
Middle Schools
Hight Schools
District Ranking in State
Statewide Rank Position Percentile (As Elementary School)
Statewide Rank Position Percentile (As Middle School)
Statewide Rank Position Percentile (As High School)