Education Period
Public 9-12
Address
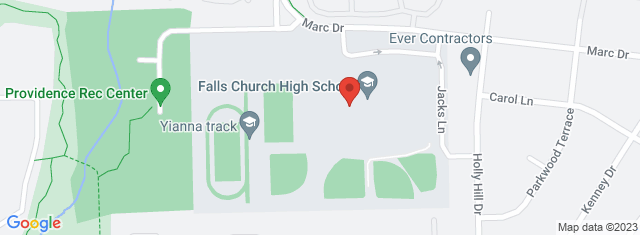
7521 Jaguar Trail Falls Church , VA 22042
Overview
Falls Church High, located in 7521 Jaguar Trail Falls Church , VA 22042, serves 1,984 students with a student/teacher ratio of 13.0. It belongs to Fairfax County Public Schools and ranks 298th of 325 Virginia High Schools.
School District
District: Fairfax County Public Schools
Number of students:
1984
Public School Search
Rank:
298th
298th of 325 Virginia High Schools
Per Pupil Expenditure
$11,139
| Student/Teacher Ratio | |
|---|---|
| Student/Teacher Ratio | 13 |
| Racial Breakdown | |
|---|---|
| Hispanic: | 55.9% |
| Asian: | 18.1% |
| White: | 17.4% |
| African American: | 5% |
| Two or more races: | 3.2% |
| American Indian: | 0.3% |
| Pacific Islander: | 0.1% |
| Free/Discounted lunch recipients | |
|---|---|
| Free/Discounted lunch recipients | 54.4% |
Performance Trends
Statewide Performance
Average Standard Score
Test Score Average
Average Standard Score
Student Body
Enrollment
Average Standard Score
% Free/Reduced Lunch
Immunization % Complete (Kindergarten)
Teachers
Student/Teacher Ratio
# Full-Time Teachers
Finance
Per Pupil Expenditures
Map and Boundary of Falls Church High
School Ranking in Virginia
PublicSchoolSearch ranks 298th of 325 Virginia High Schools.
District Ranking in State
PublicSchoolSearch ranks 298th of 325 Virginia High Schools.
Average Parent Rating
Historical Ranking of Falls Church High to other Virginia Elementary Schools
Statewide Rank Position Percentile
Impact of COVID-19 on Falls Church High
Rankings
|
Rank Pre-pandemic (2018-2019) |
Rank Pandemic (2020-2021) |
Rank Post-pandemic (2018-2019) |
Change (%) |
|---|---|---|---|
| Ranks 279th of 327 High schools | Ranks 298th of 325 High schools | 6.4% |
Test Scores
|
% proficient Pre-pandemic (2018-2019) |
% proficient Pandemic (2020-2021) | % proficient Post-pandemic (2021-2022) | Change (%) | |
|---|---|---|---|---|
| End of Course Writing (Falls Church High) | 80 | 25 |
55% | |
| End of Course Writing (Fairfax County Public Schools) | 83 | 78 |
5% | |
| End of Course Writing (Virginia) | 81 | 74 |
7% | |
| End of Course Geometry (Falls Church High) | 80 | 83 |
3% | |
| End of Course Geometry (Fairfax County Public Schools) | 86 | 90 |
4% | |
| End of Course Geometry (Virginia) | 83 | 80 |
3% | |
| End of Course Algebra I (Falls Church High) | 73 | 68 |
5% | |
| End of Course Algebra I (Fairfax County Public Schools) | 89 | 86 |
3% | |
| End of Course Algebra I (Virginia) | 86 | 80 |
6% | |
| End of Course Algebra II (Falls Church High) | 81 | 63 |
18% | |
| End of Course Algebra II (Fairfax County Public Schools) | 90 | 91 |
1% | |
| End of Course Algebra II (Virginia) | 91 | 86 |
5% | |
| End of Course Chemistry (Falls Church High) | 83 | 48 |
35% | |
| End of Course Chemistry (Fairfax County Public Schools) | 89 | 59 |
30% | |
| End of Course Chemistry (Virginia) | 88 | 64 |
24% | |
| End of Course Biology (Falls Church High) | 72 | 61 |
11% | |
| End of Course Biology (Fairfax County Public Schools) | 86 | 78 |
8% | |
| End of Course Biology (Virginia) | 83 | 70 |
13% | |
| End of Course Earth Science (Falls Church High) | 51 | 40 |
11% | |
| End of Course Earth Science (Fairfax County Public Schools) | 57 | 35 |
22% | |
| End of Course Earth Science (Virginia) | 81 | 72 |
9% | |
| End of Course English Reading (Falls Church High) | 72 | 75 |
3% | |
| End of Course English Reading (Fairfax County Public Schools) | 86 | 87 |
1% | |
| End of Course English Reading (Virginia) | 86 | 85 |
1% |
Student Body
|
Number of Students Pre-pandemic (2018-2019) |
Number of Students Pandemic (2020-2021) |
Number of Students Post-pandemic (2021-2022) |
Change (%) | |
|---|---|---|---|---|
| Total Students | 2111 | 1984 |
6% |
|
| African American | 135 | 100 |
25.9% |
|
| American Indian | 7 | 5 |
28.6% |
|
| Asian | 417 | 359 |
13.9% |
|
| Hispanic | 1078 | 1109 |
2.9% |
|
| Pacific Islander | 3 | 1 |
66.7% |
|
| White | 394 | 346 |
12.2% |
|
| Two or More Races | 77 | 64 |
16.9% |