Anza Elementary, located in 21400 Ellinwood Dr. Torrance , CA 90503-5410, serves 642 students with a student/teacher ratio of 24.1. It belongs to Torrance Unified and ranks 118th of 5,883 California Elementary Schools.
School District
District: Torrance Unified
Number of students:
642
Public School Search
Rank:
118th
118th of 5,883 California Elementary Schools
Per Pupil Expenditure
$5,164
Student/Teacher Ratio
Student/Teacher Ratio
24.1
Immunization
Fully immunized:
98.4%
Racial Breakdown
Asian:
38.5%
White:
26.2%
Hispanic:
18.8%
Two or more races:
14.6%
African American:
1.7%
Pacific Islander:
0.2%
Free/Discounted lunch recipients
Free/Discounted lunch recipients
10.7%
Performance Trends
Statewide Performance
Average Standard Score
Test Score Average
Average Standard Score
Student Body
Enrollment
Average Standard Score
% Free/Reduced Lunch
Immunization % Complete (Kindergarten)
Teachers
Student/Teacher Ratio
# Full-Time Teachers
Finance
Per Pupil Expenditures
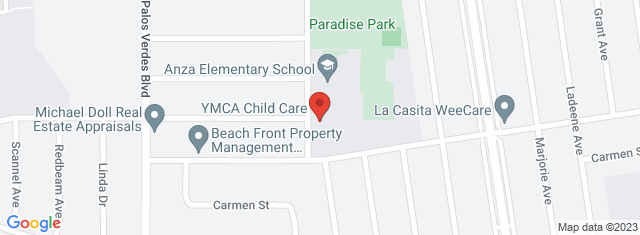
Map and Boundary of Anza Elementary
School Ranking in California
PublicSchoolSearch ranks 118th of 5,883 California Elementary Schools.
District Ranking in State
PublicSchoolSearch ranks 118th of 5,883 California Elementary Schools.
Average Parent Rating
Historical Ranking of Anza Elementary to other
California Elementary Schools
Statewide Rank Position Percentile
Anza Elementary Test Scores
Historical Enrollment Data
Concerd International School
Impact of COVID-19 on Anza Elementary
Rankings
Rank Pre-pandemic (2018-2019)
Rank Pandemic (2020-2021)
Rank Post-pandemic (2018-2019)
Change (%)
Ranks 289th of 5789 Elementary schools
Ranks 118th of 5883 Elementary schools
3%
Test Scores
% proficient Pre-pandemic (2018-2019)
% proficient Pandemic (2020-2021)
% proficient Post-pandemic (2021-2022)
Change (%)
3rd Grade English Language Arts/Literacy (Anza Elementary)
68.9
86.2
17.4%
3rd Grade English Language Arts/Literacy (Torrance Unified)
66.7
68.9
2.2%
3rd Grade English Language Arts/Literacy (California)
48.5
42.2
6.4%
3rd Grade Mathematics (Anza Elementary)
79.6
86.4
6.7%
3rd Grade Mathematics (Torrance Unified)
73.9
72.1
1.9%
3rd Grade Mathematics (California)
50.2
43.5
6.7%
4th Grade English Language Arts/Literacy (Anza Elementary)
82.5
86.5
4%
4th Grade English Language Arts/Literacy (Torrance Unified)
66.6
68.8
2.2%
4th Grade English Language Arts/Literacy (California)
49.5
44.2
5.3%
4th Grade Mathematics (Anza Elementary)
85.4
83.2
2.3%
4th Grade Mathematics (Torrance Unified)
70.5
68.3
2.2%
4th Grade Mathematics (California)
44.9
38.3
6.7%
5th Grade English Language Arts/Literacy (Anza Elementary)
84.9
82.1
2.8%
5th Grade English Language Arts/Literacy (Torrance Unified)
70.4
70.7
0.3%
5th Grade English Language Arts/Literacy (California)
51.7
47.1
4.6%
5th Grade Mathematics (Anza Elementary)
83.8
79
4.9%
5th Grade Mathematics (Torrance Unified)
65.7
61.9
3.8%
5th Grade Mathematics (California)
38
31.6
6.4%
5th Grade Science (Anza Elementary)
77.1
73.7
3.5%
5th Grade Science (Torrance Unified)
52.4
55.2
2.9%
5th Grade Science (California)
31.7
31.2
0.5%
Student Body
Number of Students Pre-pandemic (2018-2019)
Number of Students Pandemic (2020-2021)
Number of Students Post-pandemic (2021-2022)
Change (%)
Total Students
646
642
0.6%
African American
11
11
0%
American Indian
0
0
0%
Asian
238
247
3.8%
Hispanic
117
121
3.4%
Pacific Islander
1
1
0%
White
195
168
13.8%
Two or More Races
84
94
11.9%
Free/Discounted Lunch Recipients
11.1
10.7
0.4%
Compare Anza Elementary to Nearby Schools
School
Students/Teacher
School
Education Period
Address
District
Number of Students
Student\ Teacher Ratio
Free / discounted lunch recipients %
California School District Rankings
School Disctrict
Education Period
City
County
Elemen-tary Schools
Middle Schools
Hight Schools
District Ranking in State
Statewide Rank Position Percentile (As Elementary School)
Statewide Rank Position Percentile (As Middle School)
Statewide Rank Position Percentile (As High School)