Brookside Elementary, located in 116 Butterfield Rd. San Anselmo , CA 94960-1562, serves 292 students with a student/teacher ratio of 18.2. It belongs to Ross Valley Elementary and ranks 695th of 5,883 California Elementary Schools.
School District
District: Ross Valley Elementary
Number of students:
292
Public School Search
Rank:
695th
695th of 5,883 California Elementary Schools
Per Pupil Expenditure
$12,540
Student/Teacher Ratio
Student/Teacher Ratio
18.2
Immunization
Fully immunized:
97.4%
Polio:
97.4%
Racial Breakdown
White:
77.4%
Hispanic:
9.9%
Two or more races:
9.6%
Asian:
2.1%
African American:
1%
Free/Discounted lunch recipients
Free/Discounted lunch recipients
5.8%
Performance Trends
Statewide Performance
Average Standard Score
Test Score Average
Average Standard Score
Student Body
Enrollment
Average Standard Score
% Free/Reduced Lunch
Immunization % Complete (Kindergarten)
Teachers
Student/Teacher Ratio
# Full-Time Teachers
Finance
Per Pupil Expenditures
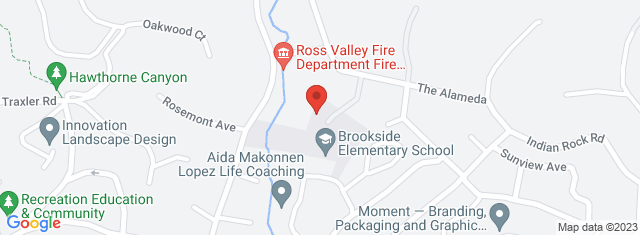
Map and Boundary of Brookside Elementary
School Ranking in California
PublicSchoolSearch ranks 695th of 5,883 California Elementary Schools.
District Ranking in State
PublicSchoolSearch ranks 695th of 5,883 California Elementary Schools.
Average Parent Rating
Historical Ranking of Brookside Elementary to other
California Elementary Schools
Statewide Rank Position Percentile
Brookside Elementary Test Scores
Historical Enrollment Data
Concerd International School
Impact of COVID-19 on Brookside Elementary
Rankings
Rank Pre-pandemic (2018-2019)
Rank Pandemic (2020-2021)
Rank Post-pandemic (2018-2019)
Change (%)
Ranks 438th of 5789 Elementary schools
Ranks 695th of 5883 Elementary schools
4.2%
Test Scores
% proficient Pre-pandemic (2018-2019)
% proficient Pandemic (2020-2021)
% proficient Post-pandemic (2021-2022)
Change (%)
3rd Grade English Language Arts/Literacy (Brookside Elementary)
77.3
72
5.3%
3rd Grade English Language Arts/Literacy (Ross Valley Elementary)
74.6
72.2
2.5%
3rd Grade English Language Arts/Literacy (California)
48.5
42.2
6.4%
3rd Grade Mathematics (Brookside Elementary)
72.7
84
11.3%
3rd Grade Mathematics (Ross Valley Elementary)
77.5
79.4
1.9%
3rd Grade Mathematics (California)
50.2
43.5
6.7%
4th Grade English Language Arts/Literacy (Brookside Elementary)
78
82.1
4.1%
4th Grade English Language Arts/Literacy (Ross Valley Elementary)
80.4
77.3
3.1%
4th Grade English Language Arts/Literacy (California)
49.5
44.2
5.3%
4th Grade Mathematics (Brookside Elementary)
78
82.1
4.1%
4th Grade Mathematics (Ross Valley Elementary)
80.8
76.3
4.5%
4th Grade Mathematics (California)
44.9
38.3
6.7%
5th Grade English Language Arts/Literacy (Brookside Elementary)
82.1
65.2
16.9%
5th Grade English Language Arts/Literacy (Ross Valley Elementary)
79.2
74.6
4.7%
5th Grade English Language Arts/Literacy (California)
51.7
47.1
4.6%
5th Grade Mathematics (Brookside Elementary)
67.9
54.4
13.5%
5th Grade Mathematics (Ross Valley Elementary)
64.3
66.5
2.2%
5th Grade Mathematics (California)
38
31.6
6.4%
5th Grade Science (Brookside Elementary)
62.5
45.7
16.9%
5th Grade Science (Ross Valley Elementary)
57.7
57.5
0.2%
5th Grade Science (California)
31.7
31.2
0.5%
Student Body
Number of Students Pre-pandemic (2018-2019)
Number of Students Pandemic (2020-2021)
Number of Students Post-pandemic (2021-2022)
Change (%)
Total Students
361
292
19.1%
African American
0
3
0%
American Indian
0
0
0%
Asian
6
6
0%
Hispanic
35
29
17.1%
Pacific Islander
0
0
0%
White
297
226
23.9%
Two or More Races
23
28
21.7%
Free/Discounted Lunch Recipients
6.4
5.8
0.5%
Compare Brookside Elementary to Nearby Schools
School
Students/Teacher
School
Education Period
Address
District
Number of Students
Student\ Teacher Ratio
Free / discounted lunch recipients %
California School District Rankings
School Disctrict
Education Period
City
County
Elemen-tary Schools
Middle Schools
Hight Schools
District Ranking in State
Statewide Rank Position Percentile (As Elementary School)
Statewide Rank Position Percentile (As Middle School)
Statewide Rank Position Percentile (As High School)