El Dorado High, located in 1651 N. Valencia Ave. Placentia , CA 92870-3030, serves 2,004 students with a student/teacher ratio of 24.8. It belongs to Placentia-Yorba Linda Unified and ranks 285th of 2,123 California High Schools.
School District
District: Placentia-Yorba Linda Unified
Number of students:
2004
Public School Search
Rank:
285th
285th of 2,123 California High Schools
Per Pupil Expenditure
$7,573
Student/Teacher Ratio
Student/Teacher Ratio
24.8
Racial Breakdown
White:
43.6%
Hispanic:
35.3%
Asian:
15.6%
Two or more races:
3.7%
African American:
1.3%
American Indian:
0.2%
Pacific Islander:
0.2%
Not Specified:
0%
Free/Discounted lunch recipients
Free/Discounted lunch recipients
35.7%
Performance Trends
Statewide Performance
Average Standard Score
Test Score Average
Average Standard Score
Student Body
Enrollment
Average Standard Score
% Free/Reduced Lunch
Immunization % Complete (Kindergarten)
Teachers
Student/Teacher Ratio
# Full-Time Teachers
Finance
Per Pupil Expenditures
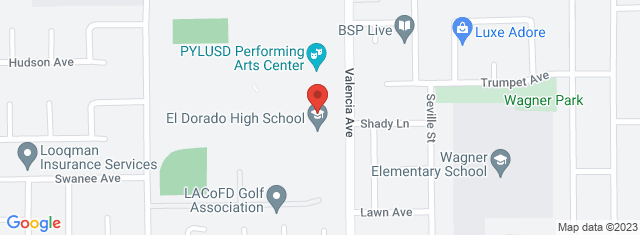
Map and Boundary of El Dorado High
School Ranking in California
PublicSchoolSearch ranks 285th of 2,123 California High Schools.
District Ranking in State
PublicSchoolSearch ranks 285th of 2,123 California High Schools.
Average Parent Rating
Historical Ranking of El Dorado High to other
California Elementary Schools
Statewide Rank Position Percentile
El Dorado High Test Scores
Historical Enrollment Data
Concerd International School
Impact of COVID-19 on El Dorado High
Rankings
Rank Pre-pandemic (2018-2019)
Rank Pandemic (2020-2021)
Rank Post-pandemic (2018-2019)
Change (%)
Ranks 230th of 2133 High schools
Ranks 285th of 2123 High schools
2.6%
Test Scores
% proficient Pre-pandemic (2018-2019)
% proficient Pandemic (2020-2021)
% proficient Post-pandemic (2021-2022)
Change (%)
11th Grade English Language Arts/Literacy (El Dorado High)
76.3
71.7
4.7%
11th Grade English Language Arts/Literacy (Placentia-Yorba Linda Unified)
74.1
67.9
6.2%
11th Grade English Language Arts/Literacy (California)
57.3
54.8
2.5%
11th Grade Mathematics (El Dorado High)
50.9
45.1
5.8%
11th Grade Mathematics (Placentia-Yorba Linda Unified)
52.5
45.1
7.4%
11th Grade Mathematics (California)
32.2
27
5.3%
11th Grade Science (El Dorado High)
42.6
45.2
2.5%
11th Grade Science (Placentia-Yorba Linda Unified)
45.8
46.6
0.8%
11th Grade Science (California)
30.4
30.8
0.4%
12th Grade Science (El Dorado High)
39.2
35.3
4%
12th Grade Science (Placentia-Yorba Linda Unified)
36.6
37.6
0.9%
12th Grade Science (California)
25.6
26.8
1.2%
Student Body
Number of Students Pre-pandemic (2018-2019)
Number of Students Pandemic (2020-2021)
Number of Students Post-pandemic (2021-2022)
Change (%)
Total Students
1990
2004
0.7%
African American
28
26
7.1%
American Indian
2
5
150%
Asian
261
312
19.5%
Hispanic
691
708
2.5%
Pacific Islander
3
4
33.3%
White
929
873
6%
Two or More Races
76
75
1.3%
Free/Discounted Lunch Recipients
25.9
35.7
9.8%
Compare El Dorado High to Nearby Schools
School
Students/Teacher
School
Education Period
Address
District
Number of Students
Student\ Teacher Ratio
Free / discounted lunch recipients %
California School District Rankings
School Disctrict
Education Period
City
County
Elemen-tary Schools
Middle Schools
Hight Schools
District Ranking in State
Statewide Rank Position Percentile (As Elementary School)
Statewide Rank Position Percentile (As Middle School)
Statewide Rank Position Percentile (As High School)