Education Period
Public, Magnet 6-12
Address
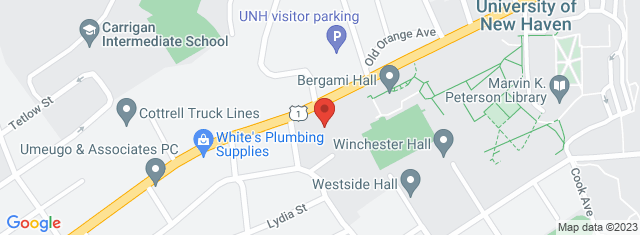
500 Boston Post Road West Haven , CT 06516
Overview
Engineering - Science University Magnet School, located in 500 Boston Post Road West Haven , CT 06516, serves 589 students with a student/teacher ratio of 10.9. It belongs to New Haven School District and ranks 28th of 139 Connecticut High Schools.
School District
District: New Haven School District
Number of students:
589
Public School Search
Rank:
28th
28th of 139 Connecticut High Schools
Per Pupil Expenditure
$17,405
| Student/Teacher Ratio | |
|---|---|
| Student/Teacher Ratio | 10.9 |
| Racial Breakdown | |
|---|---|
| African American: | 36.2% |
| White: | 28.2% |
| Hispanic: | 24.6% |
| Asian: | 6.5% |
| Two or more races: | 4.4% |
| American Indian: | 0.2% |
| Free/Discounted lunch recipients | |
|---|---|
| Free/Discounted lunch recipients | 41.6% |
Performance Trends
Statewide Performance
Average Standard Score
Test Score Average
Average Standard Score
Student Body
Enrollment
Average Standard Score
% Free/Reduced Lunch
Immunization % Complete (Kindergarten)
Teachers
Student/Teacher Ratio
# Full-Time Teachers
Finance
Per Pupil Expenditures
Map and Boundary of Engineering – Science University Magnet School
School Ranking in Connecticut
PublicSchoolSearch ranks 28th of 139 Connecticut High Schools.
District Ranking in State
PublicSchoolSearch ranks 28th of 139 Connecticut High Schools.
Average Parent Rating
Historical Ranking of Engineering – Science University Magnet School to other Connecticut Elementary Schools
Statewide Rank Position Percentile
Impact of COVID-19 on Engineering – Science University Magnet School
Rankings
|
Rank Pre-pandemic (2018-2019) |
Rank Pandemic (2020-2021) |
Rank Post-pandemic (2018-2019) |
Change (%) |
|---|---|---|---|
| Ranks 94th of 259 Middle schools | Ranks 92nd of 250 Middle schools | 0.5% | |
| Ranks 61st of 121 High schools | Ranks 28th of 139 High schools | 30.3% |
Test Scores
|
% proficient Pre-pandemic (2018-2019) |
% proficient Pandemic (2020-2021) | % proficient Post-pandemic (2021-2022) | Change (%) | |
|---|---|---|---|---|
| 6th Grade English Language Arts (Engineering - Science University Magnet School) | 67.5 | 70.2 |
2.7% | |
| 6th Grade English Language Arts (New Haven School District) | 37.6 | 27 |
10.6% | |
| 6th Grade English Language Arts (Connecticut) | 55.3 | 47.9 |
7.4% | |
| 6th Grade Mathematics (Engineering - Science University Magnet School) | 58.8 | 42.7 |
16.1% | |
| 6th Grade Mathematics (New Haven School District) | 24 | 11.6 |
12.4% | |
| 6th Grade Mathematics (Connecticut) | 45.4 | 37.1 |
8.3% | |
| 7th Grade English Language Arts (Engineering - Science University Magnet School) | 55.2 | 58.3 |
3.1% | |
| 7th Grade English Language Arts (New Haven School District) | 36.7 | 25.9 |
10.8% | |
| 7th Grade English Language Arts (Connecticut) | 56.1 | 49.7 |
6.4% | |
| 7th Grade Mathematics (Engineering - Science University Magnet School) | 47.1 | 34.6 |
12.5% | |
| 7th Grade Mathematics (New Haven School District) | 20.5 | 11.1 |
9.4% | |
| 7th Grade Mathematics (Connecticut) | 46.1 | 37.9 |
8.2% | |
| 8th Grade English Language Arts (Engineering - Science University Magnet School) | 67.4 | 51.9 |
15.5% | |
| 8th Grade English Language Arts (New Haven School District) | 33.8 | 28.7 |
5.1% | |
| 8th Grade English Language Arts (Connecticut) | 55.8 | 49.2 |
6.6% | |
| 8th Grade Mathematics (Engineering - Science University Magnet School) | 60.7 | 39.5 |
21.2% | |
| 8th Grade Mathematics (New Haven School District) | 19.4 | 10.9 |
8.5% | |
| 8th Grade Mathematics (Connecticut) | 43.5 | 34.3 |
9.2% | |
| 11th Grade English Language Arts (Engineering - Science University Magnet School) | 60.7 | 72.9 |
12.2% | |
| 11th Grade English Language Arts (New Haven School District) | 34.3 | 28.2 |
6.1% | |
| 11th Grade English Language Arts (Connecticut) | 61.6 | 55.6 |
6% | |
| 11th Grade Math (Engineering - Science University Magnet School) | 45.2 | 50.7 |
5.5% | |
| 11th Grade Math (New Haven School District) | 12.1 | 10.3 |
1.8% | |
| 11th Grade Math (Connecticut) | 40.6 | 34.8 |
5.8% |
Student Body
|
Number of Students Pre-pandemic (2018-2019) |
Number of Students Pandemic (2020-2021) |
Number of Students Post-pandemic (2021-2022) |
Change (%) | |
|---|---|---|---|---|
| Total Students | 601 | 589 |
2% |
|
| African American | 237 | 213 |
10.1% |
|
| American Indian | 0 | 1 | 0% | |
| Asian | 38 | 38 | 0% | |
| Hispanic | 119 | 145 |
21.8% |
|
| Pacific Islander | 0 | 0 | 0% | |
| White | 197 | 166 |
15.7% |
|
| Two or More Races | 10 | 26 |
160% |
|
| Free/Discounted Lunch Recipients | 39.4 | 41.6 |
2.2% |