Myrtle H. Stevens School, located in 322 Orchard St. Rocky Hill , CT 06067-2021, serves 377 students with a student/teacher ratio of 11.9. It belongs to Rocky Hill School District.
School District
District: Rocky Hill School District
Number of students:
377
Public School Search
Rank:
Per Pupil Expenditure
$14,818
Student/Teacher Ratio
Student/Teacher Ratio
11.9
Racial Breakdown
White:
59.4%
Asian:
20.2%
Hispanic:
12.5%
Two or more races:
5%
African American:
2.7%
American Indian:
0.3%
Free/Discounted lunch recipients
Free/Discounted lunch recipients
21.5%
Performance Trends
Statewide Performance
Average Standard Score
Test Score Average
Average Standard Score
Student Body
Enrollment
Average Standard Score
% Free/Reduced Lunch
Immunization % Complete (Kindergarten)
Teachers
Student/Teacher Ratio
# Full-Time Teachers
Finance
Per Pupil Expenditures
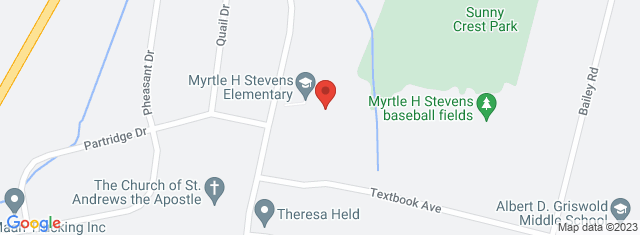
Map and Boundary of Myrtle H. Stevens School
School Ranking in Connecticut
District Ranking in State
Average Parent Rating
Historical Ranking of Myrtle H. Stevens School to other
Connecticut Elementary Schools
Statewide Rank Position Percentile
Myrtle H. Stevens School Test Scores
Historical Enrollment Data
Concerd International School
Impact of COVID-19 on Myrtle H. Stevens School
Test Scores
% proficient Pre-pandemic (2018-2019)
% proficient Pandemic (2020-2021)
% proficient Post-pandemic (2021-2022)
Change (%)
3rd Grade English Language Arts (Myrtle H. Stevens School)
60.6
61.5
0.9%
3rd Grade English Language Arts (Rocky Hill School District)
72.7
67.5
5.2%
3rd Grade English Language Arts (Connecticut)
54.3
46.7
7.6%
3rd Grade Mathematics (Myrtle H. Stevens School)
63.6
63.5
0.1%
3rd Grade Mathematics (Rocky Hill School District)
73
74
1%
3rd Grade Mathematics (Connecticut)
55
47.4
7.6%
Student Body
Number of Students Pre-pandemic (2018-2019)
Number of Students Pandemic (2020-2021)
Number of Students Post-pandemic (2021-2022)
Change (%)
Total Students
608
377
38%
African American
22
10
54.5%
American Indian
1
1
0%
Asian
113
76
32.7%
Hispanic
68
47
30.9%
Pacific Islander
0
0
0%
White
378
224
40.7%
Two or More Races
26
19
26.9%
Free/Discounted Lunch Recipients
30.1
21.5
8.6%
Compare Myrtle H. Stevens School to Nearby Schools
School
Students/Teacher
School
Education Period
Address
District
Number of Students
Student\ Teacher Ratio
Free / discounted lunch recipients %
Connecticut School District Rankings
School Disctrict
Education Period
City
County
Elemen-tary Schools
Middle Schools
Hight Schools
District Ranking in State
Statewide Rank Position Percentile (As Elementary School)
Statewide Rank Position Percentile (As Middle School)
Statewide Rank Position Percentile (As High School)