Education Period
Public, Charter 4-8
Address
100 41st Street NE Washington , DC 20019
Overview
DC Prep PCS - Benning Middle School, located in 100 41st Street NE Washington , DC 20019, serves 352 students with a student/teacher ratio of 10.3. It belongs to DC Prep PCS and ranks 19th of 59 District Of Columbia Middle Schools.
School District
District: DC Prep PCS
Number of students:
352
Public School Search
Rank:
19th
19th of 59 District Of Columbia Middle Schools
Per Pupil Expenditure
$18,633
| Student/Teacher Ratio | |
|---|---|
| Student/Teacher Ratio | 10.3 |
| Racial Breakdown | |
|---|---|
| African American: | 94.3% |
| Hispanic: | 4.5% |
| Two or more races: | 0.9% |
| Pacific Islander: | 0.3% |
| Free/Discounted lunch recipients | |
|---|---|
| Free/Discounted lunch recipients | 65.9% |
Performance Trends
Statewide Performance
Average Standard Score
Test Score Average
Average Standard Score
Student Body
Enrollment
Average Standard Score
% Free/Reduced Lunch
Immunization % Complete (Kindergarten)
Teachers
Student/Teacher Ratio
# Full-Time Teachers
Finance
Per Pupil Expenditures
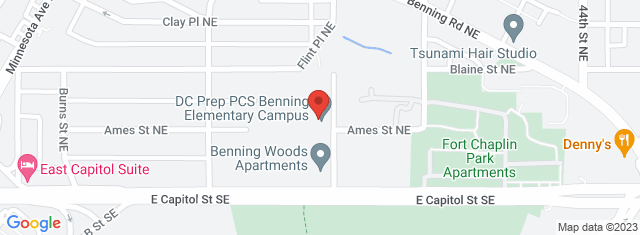
Map and Boundary of DC Prep PCS – Benning Middle School
School Ranking in District of Columbia
PublicSchoolSearch ranks 19th of 59 District Of Columbia Middle Schools.
District Ranking in State
PublicSchoolSearch ranks 19th of 59 District Of Columbia Middle Schools.
Average Parent Rating
Historical Ranking of DC Prep PCS – Benning Middle School to other District of Columbia Elementary Schools
Statewide Rank Position Percentile
Impact of COVID-19 on DC Prep PCS – Benning Middle School
Rankings
|
Rank Pre-pandemic (2018-2019) |
Rank Pandemic (2020-2021) |
Rank Post-pandemic (2018-2019) |
Change (%) |
|---|---|---|---|
| Ranks 42nd of 122 Elementary schools | Ranks 64th of 97 Elementary schools | 31.6% | |
| Ranks 9th of 75 Middle schools | Ranks 19th of 59 Middle schools | 20.2% |
Test Scores
|
% proficient Pre-pandemic (2018-2019) |
% proficient Pandemic (2020-2021) | % proficient Post-pandemic (2021-2022) | Change (%) | |
|---|---|---|---|---|
| 4th Grade Mathematics (DC Prep PCS - Benning Middle School) | 28.2 | 6.9 |
21.4% | |
| 4th Grade Mathematics (District Of Columbia) | 38.5 | 22.7 |
15.8% | |
| 4th Grade English Language Arts (DC Prep PCS - Benning Middle School) | 46.1 | 17.8 |
28.3% | |
| 4th Grade English Language Arts (DC Prep PCS) | 40.7 | 14 |
26.7% | |
| 4th Grade English Language Arts (District Of Columbia) | 38.2 | 30.4 |
7.8% | |
| 5th Grade Mathematics (DC Prep PCS - Benning Middle School) | 28.9 | 6.8 |
22.1% | |
| 5th Grade Mathematics (DC Prep PCS) | 35.7 | 12.4 |
23.3% | |
| 5th Grade Mathematics (District Of Columbia) | 32.4 | 22.1 |
10.3% | |
| 5th Grade English Language Arts (DC Prep PCS - Benning Middle School) | 34.2 | 13.5 |
20.7% | |
| 5th Grade English Language Arts (DC Prep PCS) | 31.1 | 15.2 |
15.9% | |
| 5th Grade English Language Arts (District Of Columbia) | 35.5 | 30.5 |
5% | |
| 6th Grade Mathematics (DC Prep PCS - Benning Middle School) | 35.8 | 10.5 |
25.4% | |
| 6th Grade Mathematics (DC Prep PCS) | 50 | 18.4 |
31.6% | |
| 6th Grade Mathematics (District Of Columbia) | 23.3 | 16.4 |
6.9% | |
| 6th Grade English Language Arts (DC Prep PCS - Benning Middle School) | 40.3 | 41.8 |
1.5% | |
| 6th Grade English Language Arts (DC Prep PCS) | 52.2 | 31.6 |
20.6% | |
| 6th Grade English Language Arts (District Of Columbia) | 36.5 | 28.5 |
8% | |
| 7th Grade Mathematics (DC Prep PCS - Benning Middle School) | 48.3 | 15 |
33.3% | |
| 7th Grade Mathematics (DC Prep PCS) | 56.8 | 22.5 |
34.3% | |
| 7th Grade Mathematics (District Of Columbia) | 26.2 | 21.1 |
5.1% | |
| 7th Grade English Language Arts (DC Prep PCS - Benning Middle School) | 65 | 35 |
30% | |
| 7th Grade English Language Arts (DC Prep PCS) | 69.6 | 35.7 |
33.9% | |
| 7th Grade English Language Arts (District Of Columbia) | 44 | 35.6 |
8.4% | |
| 8th Grade English Language Arts (DC Prep PCS - Benning Middle School) | 51 | 48.1 |
2.9% | |
| 8th Grade English Language Arts (DC Prep PCS) | 58.4 | 45.5 |
12.9% | |
| 8th Grade English Language Arts (District Of Columbia) | 39.6 | 31.4 |
8.2% |
Student Body
|
Number of Students Pre-pandemic (2018-2019) |
Number of Students Pandemic (2020-2021) |
Number of Students Post-pandemic (2021-2022) |
Change (%) | |
|---|---|---|---|---|
| Total Students | 341 | 352 |
3.2% |
|
| African American | 320 | 332 |
3.8% |
|
| American Indian | 0 | 0 | 0% | |
| Asian | 0 | 0 | 0% | |
| Hispanic | 16 | 16 | 0% | |
| Pacific Islander | 0 | 1 | 0% | |
| White | 0 | 0 | 0% | |
| Two or More Races | 5 | 3 |
40% |