Blanton Elementary School, located in 6400 54th Ave N St Petersburg , FL 33709-1602, serves 494 students with a student/teacher ratio of 13.7. It belongs to Pinellas and ranks 1428th of 2,219 Florida Elementary Schools.
School District
District: Pinellas
Number of students:
494
Public School Search
Rank:
1428th
1428th of 2,219 Florida Elementary Schools
Per Pupil Expenditure
$11,907
Student/Teacher Ratio
Student/Teacher Ratio
13.7
Racial Breakdown
White:
43.5%
Hispanic:
22.3%
African American:
21.9%
Asian:
7.9%
Two or more races:
3.6%
Pacific Islander:
0.6%
American Indian:
0.2%
Free/Discounted lunch recipients
Free/Discounted lunch recipients
74.1%
Performance Trends
Statewide Performance
Average Standard Score
Test Score Average
Average Standard Score
Student Body
Enrollment
Average Standard Score
% Free/Reduced Lunch
Immunization % Complete (Kindergarten)
Teachers
Student/Teacher Ratio
# Full-Time Teachers
Finance
Per Pupil Expenditures
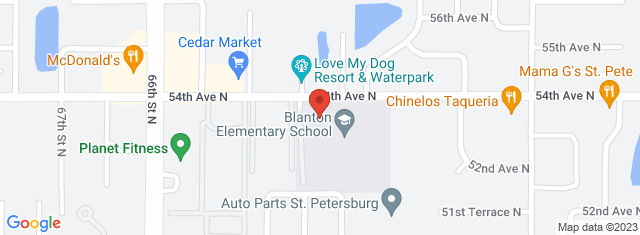
Map and Boundary of Blanton Elementary School
School Ranking in Florida
PublicSchoolSearch ranks 1428th of 2,219 Florida Elementary Schools.
District Ranking in State
PublicSchoolSearch ranks 1428th of 2,219 Florida Elementary Schools.
Average Parent Rating
Historical Ranking of Blanton Elementary School to other
Florida Elementary Schools
Statewide Rank Position Percentile
Blanton Elementary School Test Scores
Historical Enrollment Data
Concerd International School
Impact of COVID-19 on Blanton Elementary School
Rankings
Rank Pre-pandemic (2018-2019)
Rank Pandemic (2020-2021)
Rank Post-pandemic (2018-2019)
Change (%)
Ranks 1477th of 2182 Elementary schools
Ranks 1428th of 2219 Elementary schools
3.3%
Test Scores
% proficient Pre-pandemic (2018-2019)
% proficient Pandemic (2020-2021)
% proficient Post-pandemic (2021-2022)
Change (%)
3rd Grade English Language Arts (Blanton Elementary School)
56
34
22%
3rd Grade English Language Arts (Pinellas)
56
52
4%
3rd Grade English Language Arts (Florida)
58
53
5%
3rd Grade Mathematics (Blanton Elementary School)
61
45
16%
3rd Grade Mathematics (Pinellas)
62
60
2%
3rd Grade Mathematics (Florida)
62
58
4%
4th Grade English Language Arts (Blanton Elementary School)
41
46
5%
4th Grade English Language Arts (Pinellas)
56
57
1%
4th Grade English Language Arts (Florida)
58
57
1%
4th Grade Mathematics (Blanton Elementary School)
57
57
0%
4th Grade Mathematics (Pinellas)
64
65
1%
4th Grade Mathematics (Florida)
64
61
3%
5th Grade English Language Arts (Blanton Elementary School)
42
46
4%
5th Grade English Language Arts (Pinellas)
54
58
4%
5th Grade English Language Arts (Florida)
56
55
1%
5th Grade Mathematics (Blanton Elementary School)
42
52
10%
5th Grade Mathematics (Pinellas)
60
58
2%
5th Grade Mathematics (Florida)
60
52
8%
5th Grade Science (Blanton Elementary School)
42
42
0%
5th Grade Science (Pinellas)
54
55
1%
5th Grade Science (Florida)
53
48
5%
Student Body
Number of Students Pre-pandemic (2018-2019)
Number of Students Pandemic (2020-2021)
Number of Students Post-pandemic (2021-2022)
Change (%)
Total Students
523
494
5.5%
African American
85
108
27.1%
American Indian
1
1
0%
Asian
29
39
34.5%
Hispanic
145
110
24.1%
Pacific Islander
3
3
0%
White
231
215
6.9%
Two or More Races
29
18
37.9%
Free/Discounted Lunch Recipients
70.4
74.1
3.7%
Compare Blanton Elementary School to Nearby Schools
School
Students/Teacher
School
Education Period
Address
District
Number of Students
Student\ Teacher Ratio
Free / discounted lunch recipients %
Florida School District Rankings
School Disctrict
Education Period
City
County
Elemen-tary Schools
Middle Schools
Hight Schools
District Ranking in State
Statewide Rank Position Percentile (As Elementary School)
Statewide Rank Position Percentile (As Middle School)
Statewide Rank Position Percentile (As High School)