Education Period
Public 6-8
Address
1355 S Nob Hill Rd Davie , FL 33324-4222
Overview
Indian Ridge Middle School, located in 1355 S Nob Hill Rd Davie , FL 33324-4222, serves 1,896 students with a student/teacher ratio of 21.6. It belongs to Broward and ranks 352nd of 1,148 Florida Middle Schools.
School District
District: Broward
Number of students:
1896
Public School Search
Rank:
352nd
352nd of 1,148 Florida Middle Schools
Per Pupil Expenditure
$7,482
| Student/Teacher Ratio | |
|---|---|
| Student/Teacher Ratio | 21.6 |
| Racial Breakdown | |
|---|---|
| Hispanic: | 46.4% |
| White: | 39.3% |
| African American: | 7.3% |
| Asian: | 4.8% |
| Two or more races: | 2.1% |
| American Indian: | 0.1% |
| Pacific Islander: | 0.1% |
| Free/Discounted lunch recipients | |
|---|---|
| Free/Discounted lunch recipients | 39.5% |
Performance Trends
Statewide Performance
Average Standard Score
Test Score Average
Average Standard Score
Student Body
Enrollment
Average Standard Score
% Free/Reduced Lunch
Immunization % Complete (Kindergarten)
Teachers
Student/Teacher Ratio
# Full-Time Teachers
Finance
Per Pupil Expenditures
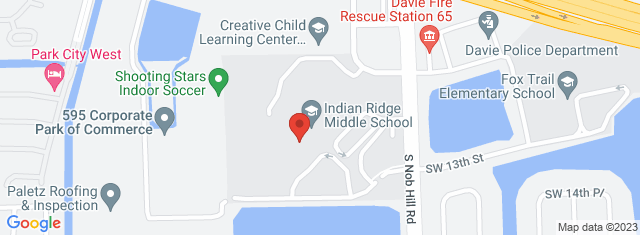
Map and Boundary of Indian Ridge Middle School
School Ranking in Florida
PublicSchoolSearch ranks 352nd of 1,148 Florida Middle Schools.
District Ranking in State
PublicSchoolSearch ranks 352nd of 1,148 Florida Middle Schools.
Average Parent Rating
Historical Ranking of Indian Ridge Middle School to other Florida Elementary Schools
Statewide Rank Position Percentile
Impact of COVID-19 on Indian Ridge Middle School
Rankings
|
Rank Pre-pandemic (2018-2019) |
Rank Pandemic (2020-2021) |
Rank Post-pandemic (2018-2019) |
Change (%) |
|---|---|---|---|
| Ranks 245th of 1099 Middle schools | Ranks 352nd of 1148 Middle schools | 8.4% |
Test Scores
|
% proficient Pre-pandemic (2018-2019) |
% proficient Pandemic (2020-2021) | % proficient Post-pandemic (2021-2022) | Change (%) | |
|---|---|---|---|---|
| 6th Grade English Language Arts (Indian Ridge Middle School) | 66 | 62 |
4% | |
| 6th Grade English Language Arts (Broward) | 57 | 55 |
2% | |
| 6th Grade English Language Arts (Florida) | 54 | 52 |
2% | |
| 6th Grade Mathematics (Indian Ridge Middle School) | 72 | 57 |
15% | |
| 6th Grade Mathematics (Broward) | 58 | 48 |
10% | |
| 6th Grade Mathematics (Florida) | 55 | 49 |
6% | |
| 7th Grade English Language Arts (Indian Ridge Middle School) | 63 | 55 |
8% | |
| 7th Grade English Language Arts (Broward) | 55 | 50 |
5% | |
| 7th Grade English Language Arts (Florida) | 52 | 48 |
4% | |
| 7th Grade Mathematics (Indian Ridge Middle School) | 72 | 55 |
17% | |
| 7th Grade Mathematics (Broward) | 53 | 45 |
8% | |
| 7th Grade Mathematics (Florida) | 54 | 46 |
8% | |
| 8th Grade English Language Arts (Indian Ridge Middle School) | 72 | 64 |
8% | |
| 8th Grade English Language Arts (Broward) | 59 | 51 |
8% | |
| 8th Grade English Language Arts (Florida) | 56 | 49 |
7% | |
| 8th Grade Mathematics (Indian Ridge Middle School) | 69 | 48 |
21% | |
| 8th Grade Mathematics (Broward) | 45 | 34 |
11% | |
| 8th Grade Mathematics (Florida) | 46 | 42 |
4% | |
| 8th Grade Science (Indian Ridge Middle School) | 53 | 43 |
10% | |
| 8th Grade Science (Broward) | 43 | 40 |
3% | |
| 8th Grade Science (Florida) | 48 | 45 |
3% | |
| End of Course Biology 1 (Indian Ridge Middle School) | 100 | 95 |
5% | |
| End of Course Biology 1 (Broward) | 68 | 59 |
9% | |
| End of Course Biology 1 (Florida) | 67 | 61 |
6% | |
| End of Course Civics (Indian Ridge Middle School) | 83 | 72 |
11% | |
| End of Course Civics (Broward) | 71 | 68 |
3% | |
| End of Course Civics (Florida) | 71 | 69 |
2% | |
| End of Course Algebra 1 (Indian Ridge Middle School) | 100 | 91 |
9% | |
| End of Course Algebra 1 (Broward) | 62 | 50 |
12% | |
| End of Course Algebra 1 (Florida) | 62 | 54 |
8% | |
| End of Course Geometry (Indian Ridge Middle School) | 99 | 99 |
0% | |
| End of Course Geometry (Broward) | 56 | 45 |
11% | |
| End of Course Geometry (Florida) | 57 | 50 |
7% |
Student Body
|
Number of Students Pre-pandemic (2018-2019) |
Number of Students Pandemic (2020-2021) |
Number of Students Post-pandemic (2021-2022) |
Change (%) | |
|---|---|---|---|---|
| Total Students | 1985 | 1896 |
4.5% |
|
| African American | 151 | 138 |
8.6% |
|
| American Indian | 4 | 2 |
50% |
|
| Asian | 82 | 91 |
11% |
|
| Hispanic | 808 | 879 |
8.8% |
|
| Pacific Islander | 0 | 1 | 0% | |
| White | 901 | 746 |
17.2% |
|
| Two or More Races | 39 | 39 | 0% | |
| Free/Discounted Lunch Recipients | 40.6 | 39.5 |
1.1% |