Sheridan Technical College, located in 5400 Sheridan St Hollywood , FL 33021-3346, serves 576 students with a student/teacher ratio of 12.8. It belongs to Broward and ranks 22nd of 774 Florida High Schools.
School District
District: Broward
Number of students:
576
Public School Search
Rank:
22nd
22nd of 774 Florida High Schools
Per Pupil Expenditure
$9,499
Student/Teacher Ratio
Student/Teacher Ratio
12.8
Racial Breakdown
Hispanic:
37.2%
African American:
36.8%
White:
19.3%
Asian:
4%
Two or more races:
2.3%
American Indian:
0.5%
Free/Discounted lunch recipients
Free/Discounted lunch recipients
55.2%
Performance Trends
Statewide Performance
Average Standard Score
Test Score Average
Average Standard Score
Student Body
Enrollment
Average Standard Score
% Free/Reduced Lunch
Immunization % Complete (Kindergarten)
Teachers
Student/Teacher Ratio
# Full-Time Teachers
Finance
Per Pupil Expenditures
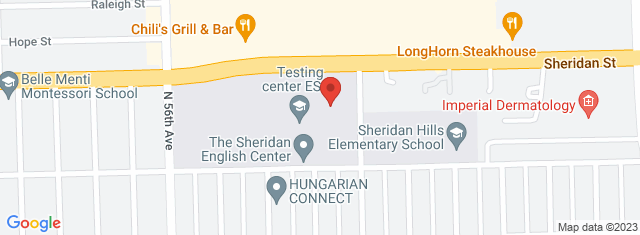
Map and Boundary of Sheridan Technical College
School Ranking in Florida
PublicSchoolSearch ranks 22nd of 774 Florida High Schools.
District Ranking in State
PublicSchoolSearch ranks 22nd of 774 Florida High Schools.
Average Parent Rating
Historical Ranking of Sheridan Technical College to other
Florida Elementary Schools
Statewide Rank Position Percentile
Sheridan Technical College Test Scores
Historical Enrollment Data
Concerd International School
Impact of COVID-19 on Sheridan Technical College
Rankings
Rank Pre-pandemic (2018-2019)
Rank Pandemic (2020-2021)
Rank Post-pandemic (2018-2019)
Change (%)
Ranks 5th of 734 High schools
Ranks 22nd of 774 High schools
2.2%
Test Scores
% proficient Pre-pandemic (2018-2019)
% proficient Pandemic (2020-2021)
% proficient Post-pandemic (2021-2022)
Change (%)
9th Grade English Language Arts (Sheridan Technical College)
97
85
12%
9th Grade English Language Arts (Broward)
57
53
4%
9th Grade English Language Arts (Florida)
55
51
4%
10th Grade English Language Arts (Sheridan Technical College)
96
93
3%
10th Grade English Language Arts (Broward)
53
49
4%
10th Grade English Language Arts (Florida)
53
49
4%
End of Course US History (Sheridan Technical College)
98
95
3%
End of Course US History (Broward)
67
64
3%
End of Course US History (Florida)
70
65
5%
End of Course Algebra 1 (Sheridan Technical College)
95
75
20%
End of Course Algebra 1 (Broward)
62
50
12%
End of Course Algebra 1 (Florida)
62
54
8%
End of Course Geometry (Sheridan Technical College)
85
80
5%
End of Course Geometry (Broward)
56
45
11%
End of Course Geometry (Florida)
57
50
7%
Student Body
Number of Students Pre-pandemic (2018-2019)
Number of Students Pandemic (2020-2021)
Number of Students Post-pandemic (2021-2022)
Change (%)
Total Students
567
576
1.6%
African American
222
212
4.5%
American Indian
1
3
200%
Asian
16
23
43.8%
Hispanic
204
214
4.9%
Pacific Islander
1
0
100%
White
115
111
3.5%
Two or More Races
8
13
62.5%
Free/Discounted Lunch Recipients
53.4
55.2
1.8%
Compare Sheridan Technical College to Nearby Schools
School
Students/Teacher
School
Education Period
Address
District
Number of Students
Student\ Teacher Ratio
Free / discounted lunch recipients %
Florida School District Rankings
School Disctrict
Education Period
City
County
Elemen-tary Schools
Middle Schools
Hight Schools
District Ranking in State
Statewide Rank Position Percentile (As Elementary School)
Statewide Rank Position Percentile (As Middle School)
Statewide Rank Position Percentile (As High School)