Trinity Day Academy, located in 181 Hillman Street New Bedford , MA 02740, serves 95 students with a student/teacher ratio of 7.3. It belongs to New Bedford.
School District
District: New Bedford
Number of students:
95
Public School Search
Rank:
Per Pupil Expenditure
$27,675
Student/Teacher Ratio
Student/Teacher Ratio
7.3
Racial Breakdown
White:
38.9%
Hispanic:
34.7%
African American:
16.8%
Two or more races:
9.5%
Free/Discounted lunch recipients
Free/Discounted lunch recipients
100%
Performance Trends
Statewide Performance
Average Standard Score
Test Score Average
Average Standard Score
Student Body
Enrollment
Average Standard Score
% Free/Reduced Lunch
Immunization % Complete (Kindergarten)
Teachers
Student/Teacher Ratio
# Full-Time Teachers
Finance
Per Pupil Expenditures
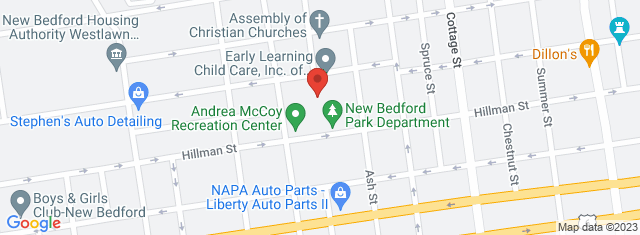
Map and Boundary of Trinity Day Academy
School Ranking in Massachusetts
District Ranking in State
Average Parent Rating
Historical Ranking of Trinity Day Academy to other
Massachusetts Elementary Schools
Statewide Rank Position Percentile
Trinity Day Academy Test Scores
Historical Enrollment Data
Concerd International School
Impact of COVID-19 on Trinity Day Academy
Rankings
Rank Pre-pandemic (2018-2019)
Rank Pandemic (2020-2021)
Rank Post-pandemic (2018-2019)
Change (%)
Ranks 491st of 498 Middle schools
Ranks 497th of 497 Middle schools
1.4%
Test Scores
% proficient Pre-pandemic (2018-2019)
% proficient Pandemic (2020-2021)
% proficient Post-pandemic (2021-2022)
Change (%)
8th Grade English Language Arts (Trinity Day Academy)
0
0
2.5%
8th Grade English Language Arts (New Bedford)
20
22.6
9.1%
8th Grade English Language Arts (Massachusetts)
51
41.9
6%
All Grades English Language Arts (Trinity Day Academy)
6
0
10.9%
All Grades English Language Arts (New Bedford)
35
24.1
10.8%
All Grades English Language Arts (Massachusetts)
52
41.3
0%
All Grades Mathematics (Trinity Day Academy)
0
0
10%
All Grades Mathematics (New Bedford)
32
22
9.9%
All Grades Mathematics (Massachusetts)
49
39.1
10%
All Grades Science (Trinity Day Academy)
5
15
5.2%
All Grades Science (New Bedford)
25
19.8
5.2%
All Grades Science (Massachusetts)
47
41.8
%
Student Body
Number of Students Pre-pandemic (2018-2019)
Number of Students Pandemic (2020-2021)
Number of Students Post-pandemic (2021-2022)
Change (%)
Total Students
95
95
100%
African American
8
16
0%
American Indian
0
0
0%
Asian
0
0
2.9%
Hispanic
34
33
0%
Pacific Islander
0
0
17.8%
White
45
37
12.5%
Two or More Races
8
9
0%
Compare Trinity Day Academy to Nearby Schools
School
Students/Teacher
School
Education Period
Address
District
Number of Students
Student\ Teacher Ratio
Free / discounted lunch recipients %
Massachusetts School District Rankings
School Disctrict
Education Period
City
County
Elemen-tary Schools
Middle Schools
Hight Schools
District Ranking in State
Statewide Rank Position Percentile (As Elementary School)
Statewide Rank Position Percentile (As Middle School)
Statewide Rank Position Percentile (As High School)