Education Period
Public K-5
Address
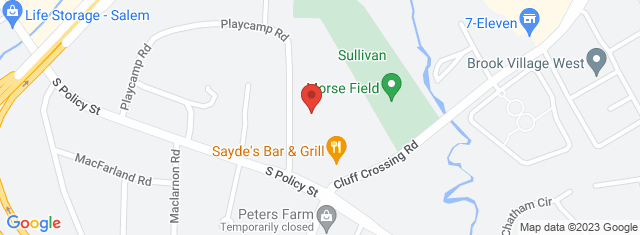
173 South Policy St. Salem , NH 03079-3734
Overview
Dr. L. F. Soule School, located in 173 South Policy St. Salem , NH 03079-3734, serves 249 students with a student/teacher ratio of 10.7. It belongs to Salem School District and ranks 149th of 233 New Hampshire Elementary Schools.
School District
District: Salem School District
Number of students:
249
Public School Search
Rank:
149th
149th of 233 New Hampshire Elementary Schools
Per Pupil Expenditure
$19,874
| Student/Teacher Ratio | |
|---|---|
| Student/Teacher Ratio | 10.7 |
| Racial Breakdown | |
|---|---|
| White: | 63.5% |
| Hispanic: | 19.7% |
| Two or more races: | 8.4% |
| Asian: | 5.2% |
| African American: | 3.2% |
| Free/Discounted lunch recipients | |
|---|---|
| Free/Discounted lunch recipients | 21.7% |
Performance Trends
Statewide Performance
Average Standard Score
Test Score Average
Average Standard Score
Student Body
Enrollment
Average Standard Score
% Free/Reduced Lunch
Immunization % Complete (Kindergarten)
Teachers
Student/Teacher Ratio
# Full-Time Teachers
Finance
Per Pupil Expenditures
Map and Boundary of Dr. L. F. Soule School
School Ranking in New Hampshire
PublicSchoolSearch ranks 149th of 233 New Hampshire Elementary Schools.
District Ranking in State
PublicSchoolSearch ranks 149th of 233 New Hampshire Elementary Schools.
Average Parent Rating
Historical Ranking of Dr. L. F. Soule School to other New Hampshire Elementary Schools
Statewide Rank Position Percentile
Impact of COVID-19 on Dr. L. F. Soule School
Rankings
|
Rank Pre-pandemic (2018-2019) |
Rank Pandemic (2020-2021) |
Rank Post-pandemic (2018-2019) |
Change (%) |
|---|---|---|---|
| Ranks 180th of 231 Elementary schools | Ranks 149th of 233 Elementary schools | 14% |
Test Scores
|
% proficient Pre-pandemic (2018-2019) |
% proficient Pandemic (2020-2021) | % proficient Post-pandemic (2021-2022) | Change (%) | |
|---|---|---|---|---|
| 3rd Grade Mathematics (Dr. L. F. Soule School) | 44 | 54 |
10% | |
| 3rd Grade Mathematics (Salem School District) | 59 | 64 |
5% | |
| 3rd Grade Mathematics (New Hampshire) | 57 | 51 |
6% | |
| 3rd Grade Reading (Dr. L. F. Soule School) | 40 | 40 |
0% | |
| 3rd Grade Reading (Salem School District) | 52 | 48 |
4% | |
| 3rd Grade Reading (New Hampshire) | 52 | 45 |
7% | |
| 4th Grade Mathematics (Dr. L. F. Soule School) | 34 | 42 |
8% | |
| 4th Grade Mathematics (Salem School District) | 58 | 58 |
0% | |
| 4th Grade Mathematics (New Hampshire) | 52 | 48 |
4% | |
| 4th Grade Reading (Dr. L. F. Soule School) | 39 | 47 |
8% | |
| 4th Grade Reading (Salem School District) | 56 | 53 |
3% | |
| 4th Grade Reading (New Hampshire) | 55 | 48 |
7% | |
| 5th Grade Mathematics (Dr. L. F. Soule School) | 39 | 36 |
3% | |
| 5th Grade Mathematics (Salem School District) | 53 | 49 |
4% | |
| 5th Grade Mathematics (New Hampshire) | 44 | 38 |
6% | |
| 5th Grade Reading (Dr. L. F. Soule School) | 58 | 36 |
22% | |
| 5th Grade Reading (Salem School District) | 67 | 55 |
12% | |
| 5th Grade Reading (New Hampshire) | 57 | 54 |
3% | |
| 5th Grade Science (Dr. L. F. Soule School) | 28 | 25 |
3% | |
| 5th Grade Science (Salem School District) | 39 | 33 |
6% | |
| 5th Grade Science (New Hampshire) | 38 | 38 |
0% | |
| All Grades Mathematics (Dr. L. F. Soule School) | 39 | 44 |
5% | |
| All Grades Mathematics (Salem School District) | 51 | 47 |
4% | |
| All Grades Mathematics (New Hampshire) | 48 | 40 |
8% | |
| All Grades Reading (Dr. L. F. Soule School) | 45 | 41 |
4% | |
| All Grades Reading (Salem School District) | 58 | 54 |
4% | |
| All Grades Reading (New Hampshire) | 56 | 51 |
5% | |
| All Grades Science (Dr. L. F. Soule School) | 28 | 25 |
3% | |
| All Grades Science (Salem School District) | 41 | 37 |
4% | |
| All Grades Science (New Hampshire) | 40 | 37 |
3% |
Student Body
|
Number of Students Pre-pandemic (2018-2019) |
Number of Students Pandemic (2020-2021) |
Number of Students Post-pandemic (2021-2022) |
Change (%) | |
|---|---|---|---|---|
| Total Students | 241 | 249 |
3.3% |
|
| African American | 9 | 8 |
11.1% |
|
| American Indian | 0 | 0 | 0% | |
| Asian | 13 | 13 | 0% | |
| Hispanic | 55 | 49 |
10.9% |
|
| Pacific Islander | 0 | 0 | 0% | |
| White | 153 | 158 |
3.3% |
|
| Two or More Races | 11 | 21 |
90.9% |
|
| Free/Discounted Lunch Recipients | 31.1 | 21.7 |
9.4% |