Education Period
Public K-8
Address
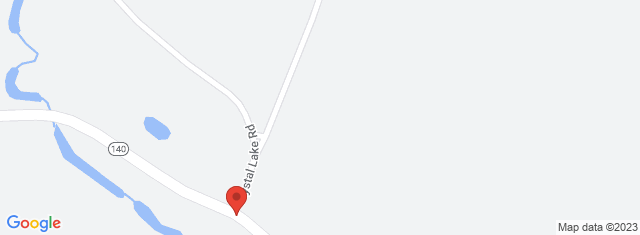
1386 NH Rte. 140 Gilmanton IW , NH 03837-9715
Overview
Gilmanton Elementary School, located in 1386 NH Rte. 140 Gilmanton IW , NH 03837-9715, serves 387 students with a student/teacher ratio of 10.1. It belongs to Gilmanton School District and ranks 15th of 233 New Hampshire Elementary Schools.
School District
District: Gilmanton School District
Number of students:
387
Public School Search
Rank:
15th
15th of 233 New Hampshire Elementary Schools
Per Pupil Expenditure
$17,297
| Student/Teacher Ratio | |
|---|---|
| Student/Teacher Ratio | 10.1 |
| Racial Breakdown | |
|---|---|
| White: | 95.6% |
| Two or more races: | 2.8% |
| Hispanic: | 1% |
| African American: | 0.3% |
| Asian: | 0.3% |
| Free/Discounted lunch recipients | |
|---|---|
| Free/Discounted lunch recipients | 16.5% |
Performance Trends
Statewide Performance
Average Standard Score
Test Score Average
Average Standard Score
Student Body
Enrollment
Average Standard Score
% Free/Reduced Lunch
Immunization % Complete (Kindergarten)
Teachers
Student/Teacher Ratio
# Full-Time Teachers
Finance
Per Pupil Expenditures
Map and Boundary of Gilmanton Elementary School
School Ranking in New Hampshire
PublicSchoolSearch ranks 15th of 233 New Hampshire Elementary Schools.
District Ranking in State
PublicSchoolSearch ranks 15th of 233 New Hampshire Elementary Schools.
Average Parent Rating
Historical Ranking of Gilmanton Elementary School to other New Hampshire Elementary Schools
Statewide Rank Position Percentile
Impact of COVID-19 on Gilmanton Elementary School
Rankings
|
Rank Pre-pandemic (2018-2019) |
Rank Pandemic (2020-2021) |
Rank Post-pandemic (2018-2019) |
Change (%) |
|---|---|---|---|
| Ranks 25th of 231 Elementary schools | Ranks 15th of 233 Elementary schools | 4.4% | |
| Ranks 26th of 128 Middle schools | Ranks 33rd of 130 Middle schools | 5.1% |
Test Scores
|
% proficient Pre-pandemic (2018-2019) |
% proficient Pandemic (2020-2021) | % proficient Post-pandemic (2021-2022) | Change (%) | |
|---|---|---|---|---|
| 3rd Grade Mathematics (Gilmanton Elementary School) | 75 | 70 |
5% | |
| 3rd Grade Mathematics (Gilmanton School District) | 75 | 70 |
5% | |
| 3rd Grade Mathematics (New Hampshire) | 57 | 51 |
6% | |
| 3rd Grade Reading (Gilmanton Elementary School) | 75 | 68 |
7% | |
| 3rd Grade Reading (Gilmanton School District) | 73 | 68 |
5% | |
| 3rd Grade Reading (New Hampshire) | 52 | 45 |
7% | |
| 4th Grade Mathematics (Gilmanton Elementary School) | 76 | 70 |
6% | |
| 4th Grade Mathematics (Gilmanton School District) | 76 | 70 |
6% | |
| 4th Grade Mathematics (New Hampshire) | 52 | 48 |
4% | |
| 4th Grade Reading (Gilmanton Elementary School) | 74 | 59 |
15% | |
| 4th Grade Reading (Gilmanton School District) | 74 | 59 |
15% | |
| 4th Grade Reading (New Hampshire) | 55 | 48 |
7% | |
| 5th Grade Mathematics (Gilmanton Elementary School) | 83 | 66 |
17% | |
| 5th Grade Mathematics (Gilmanton School District) | 83 | 66 |
17% | |
| 5th Grade Mathematics (New Hampshire) | 44 | 38 |
6% | |
| 5th Grade Reading (Gilmanton Elementary School) | 85 | 83 |
2% | |
| 5th Grade Reading (Gilmanton School District) | 85 | 83 |
2% | |
| 5th Grade Reading (New Hampshire) | 57 | 54 |
3% | |
| 5th Grade Science (Gilmanton Elementary School) | 43 | 63 |
20% | |
| 5th Grade Science (Gilmanton School District) | 43 | 63 |
20% | |
| 5th Grade Science (New Hampshire) | 38 | 38 |
0% | |
| 6th Grade Mathematics (Gilmanton Elementary School) | 63 | 60 |
3% | |
| 6th Grade Mathematics (Gilmanton School District) | 63 | 60 |
3% | |
| 6th Grade Mathematics (New Hampshire) | 47 | 39 |
8% | |
| 6th Grade Reading (Gilmanton Elementary School) | 65 | 71 |
6% | |
| 6th Grade Reading (Gilmanton School District) | 65 | 71 |
6% | |
| 6th Grade Reading (New Hampshire) | 56 | 53 |
3% | |
| 7th Grade Mathematics (Gilmanton Elementary School) | 66 | 38 |
28% | |
| 7th Grade Mathematics (Gilmanton School District) | 66 | 38 |
28% | |
| 7th Grade Mathematics (New Hampshire) | 47 | 37 |
10% | |
| 7th Grade Reading (Gilmanton Elementary School) | 68 | 62 |
6% | |
| 7th Grade Reading (Gilmanton School District) | 68 | 62 |
6% | |
| 7th Grade Reading (New Hampshire) | 56 | 49 |
7% | |
| 8th Grade Mathematics (Gilmanton Elementary School) | 59 | 42 |
17% | |
| 8th Grade Mathematics (Gilmanton School District) | 59 | 42 |
17% | |
| 8th Grade Mathematics (New Hampshire) | 45 | 33 |
12% | |
| 8th Grade Reading (Gilmanton Elementary School) | 77 | 51 |
26% | |
| 8th Grade Reading (Gilmanton School District) | 77 | 51 |
26% | |
| 8th Grade Reading (New Hampshire) | 53 | 46 |
7% | |
| 8th Grade Science (Gilmanton Elementary School) | 48 | 30 |
18% | |
| 8th Grade Science (Gilmanton School District) | 48 | 30 |
18% | |
| 8th Grade Science (New Hampshire) | 41 | 33 |
8% | |
| All Grades Mathematics (Gilmanton Elementary School) | 70 | 58 |
12% | |
| All Grades Mathematics (Gilmanton School District) | 70 | 58 |
12% | |
| All Grades Mathematics (New Hampshire) | 48 | 40 |
8% | |
| All Grades Reading (Gilmanton Elementary School) | 74 | 65 |
9% | |
| All Grades Reading (Gilmanton School District) | 73 | 65 |
8% | |
| All Grades Reading (New Hampshire) | 56 | 51 |
5% | |
| All Grades Science (Gilmanton Elementary School) | 45 | 44 |
1% | |
| All Grades Science (Gilmanton School District) | 45 | 44 |
1% | |
| All Grades Science (New Hampshire) | 40 | 37 |
3% |
Student Body
|
Number of Students Pre-pandemic (2018-2019) |
Number of Students Pandemic (2020-2021) |
Number of Students Post-pandemic (2021-2022) |
Change (%) | |
|---|---|---|---|---|
| Total Students | 407 | 387 |
4.9% |
|
| African American | 4 | 1 |
75% |
|
| American Indian | 0 | 0 | 0% | |
| Asian | 0 | 1 | 0% | |
| Hispanic | 3 | 4 |
33.3% |
|
| Pacific Islander | 0 | 0 | 0% | |
| White | 385 | 370 |
3.9% |
|
| Two or More Races | 15 | 11 |
26.7% |
|
| Free/Discounted Lunch Recipients | 17 | 16.5 |
0.4% |