Essex County West Caldwell Technical, located in 620 Passaic Ave West Caldwell , NJ 07006, serves 336 students with a student/teacher ratio of 9.6. It belongs to Essex County Schools of Technology and ranks 329th of 405 New Jersey High Schools.
School District
District: Essex County Schools of Technology
Number of students:
336
Public School Search
Rank:
329th
329th of 405 New Jersey High Schools
Per Pupil Expenditure
$13,110
Student/Teacher Ratio
Student/Teacher Ratio
9.6
Racial Breakdown
Hispanic:
56%
African American:
40.2%
White:
2.7%
Two or more races:
0.9%
Pacific Islander:
0.3%
Free/Discounted lunch recipients
Free/Discounted lunch recipients
66.4%
Performance Trends
Statewide Performance
Average Standard Score
Test Score Average
Average Standard Score
Student Body
Enrollment
Average Standard Score
% Free/Reduced Lunch
Immunization % Complete (Kindergarten)
Teachers
Student/Teacher Ratio
# Full-Time Teachers
Finance
Per Pupil Expenditures
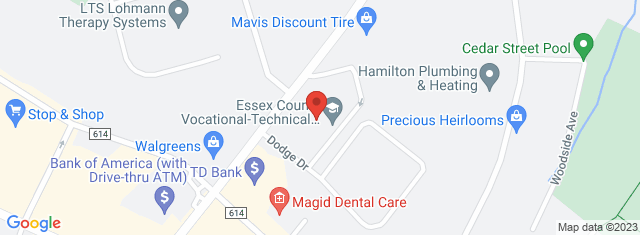
Map and Boundary of Essex County West Caldwell Technical
School Ranking in New Jersey
PublicSchoolSearch ranks 329th of 405 New Jersey High Schools.
District Ranking in State
PublicSchoolSearch ranks 329th of 405 New Jersey High Schools.
Average Parent Rating
Historical Ranking of Essex County West Caldwell Technical to other
New Jersey Elementary Schools
Statewide Rank Position Percentile
Essex County West Caldwell Technical Test Scores
Historical Enrollment Data
Concerd International School
Impact of COVID-19 on Essex County West Caldwell Technical
Rankings
Rank Pre-pandemic (2018-2019)
Rank Pandemic (2020-2021)
Rank Post-pandemic (2018-2019)
Change (%)
Ranks 258th of 416 High schools
Ranks 329th of 405 High schools
19.2%
Student Body
Number of Students Pre-pandemic (2018-2019)
Number of Students Pandemic (2020-2021)
Number of Students Post-pandemic (2021-2022)
Change (%)
Total Students
306
336
9.8%
African American
137
135
1.5%
American Indian
0
0
0%
Asian
1
0
100%
Hispanic
159
188
18.2%
Pacific Islander
1
1
0%
White
7
9
28.6%
Two or More Races
1
3
200%
Free/Discounted Lunch Recipients
51.3
66.4
15.1%
Compare Essex County West Caldwell Technical to Nearby Schools
School
Students/Teacher
School
Education Period
Address
District
Number of Students
Student\ Teacher Ratio
Free / discounted lunch recipients %
New Jersey School District Rankings
School Disctrict
Education Period
City
County
Elemen-tary Schools
Middle Schools
Hight Schools
District Ranking in State
Statewide Rank Position Percentile (As Elementary School)
Statewide Rank Position Percentile (As Middle School)
Statewide Rank Position Percentile (As High School)