Ben Franklin Middle School, located in 540 Parkhurst Blvd Buffalo , NY 14223-2198, serves 648 students with a student/teacher ratio of 9.6. It belongs to Kenmore-Tonawanda Union Free School District and ranks 874th of 1,479 New York Middle Schools.
School District
District: Kenmore-Tonawanda Union Free School District
Number of students:
648
Public School Search
Rank:
874th
874th of 1,479 New York Middle Schools
Per Pupil Expenditure
$17,893
Student/Teacher Ratio
Student/Teacher Ratio
9.6
Immunization
Fully immunized:
98.6%
Measles:
99.7%
Polio:
99.2%
Measles:
99.7%
Diphtheria:
99.4%
Hepatitis B:
99.8%
Varicella:
99.4%
Racial Breakdown
White:
70.7%
Hispanic:
10.5%
African American:
7.7%
Two or more races:
7.3%
Asian:
3.4%
American Indian:
0.5%
Free/Discounted lunch recipients
Free/Discounted lunch recipients
57.7%
Performance Trends
Statewide Performance
Average Standard Score
Test Score Average
Average Standard Score
Student Body
Enrollment
Average Standard Score
% Free/Reduced Lunch
Immunization % Complete (Kindergarten)
Teachers
Student/Teacher Ratio
# Full-Time Teachers
Finance
Per Pupil Expenditures
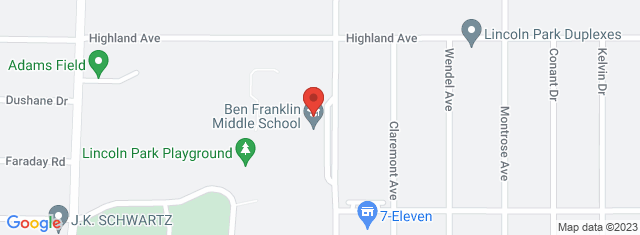
Map and Boundary of Ben Franklin Middle School
School Ranking in New York
PublicSchoolSearch ranks 874th of 1,479 New York Middle Schools.
District Ranking in State
PublicSchoolSearch ranks 874th of 1,479 New York Middle Schools.
Average Parent Rating
Historical Ranking of Ben Franklin Middle School to other
New York Elementary Schools
Statewide Rank Position Percentile
Ben Franklin Middle School Test Scores
Historical Enrollment Data
Concerd International School
Impact of COVID-19 on Ben Franklin Middle School
Rankings
Rank Pre-pandemic (2018-2019)
Rank Pandemic (2020-2021)
Rank Post-pandemic (2018-2019)
Change (%)
Ranks 718th of 1439 Middle schools
Ranks 874th of 1479 Middle schools
9.2%
Test Scores
% proficient Pre-pandemic (2018-2019)
% proficient Pandemic (2020-2021)
% proficient Post-pandemic (2021-2022)
Change (%)
5th Grade English Language Arts (Ben Franklin Middle School)
31
23.6
7.4%
5th Grade English Language Arts (Kenmore-Tonawanda Union Free School District)
30
26.9
3.1%
5th Grade English Language Arts (New York)
38
37.7
0.3%
5th Grade Math (Ben Franklin Middle School)
42
29.6
12.4%
5th Grade Math (Kenmore-Tonawanda Union Free School District)
45
25.3
19.7%
5th Grade Math (New York)
46
36.9
9.1%
6th Grade English Language Arts (Ben Franklin Middle School)
29
43.9
14.9%
6th Grade English Language Arts (Kenmore-Tonawanda Union Free School District)
34
46.9
12.9%
6th Grade English Language Arts (New York)
47
56.6
9.6%
6th Grade Math (Ben Franklin Middle School)
41
39.8
1.2%
6th Grade Math (Kenmore-Tonawanda Union Free School District)
40
38.8
1.2%
6th Grade Math (New York)
47
38.3
8.7%
7th Grade English Language Arts (Ben Franklin Middle School)
40
34.3
5.7%
7th Grade English Language Arts (Kenmore-Tonawanda Union Free School District)
35
32.8
2.2%
7th Grade English Language Arts (New York)
40
48
8%
7th Grade Math (Ben Franklin Middle School)
50
34.1
15.9%
7th Grade Math (Kenmore-Tonawanda Union Free School District)
45
35.6
9.4%
7th Grade Math (New York)
44
35.3
8.7%
Student Body
Number of Students Pre-pandemic (2018-2019)
Number of Students Pandemic (2020-2021)
Number of Students Post-pandemic (2021-2022)
Change (%)
Total Students
654
648
0.9%
African American
54
50
7.4%
American Indian
3
3
0%
Asian
11
22
100%
Hispanic
57
68
19.3%
Pacific Islander
0
0
0%
White
488
458
6.1%
Two or More Races
41
47
14.6%
Free/Discounted Lunch Recipients
55.8
57.7
1.9%
Compare Ben Franklin Middle School to Nearby Schools
School
Students/Teacher
School
Education Period
Address
District
Number of Students
Student\ Teacher Ratio
Free / discounted lunch recipients %
New York School District Rankings
School Disctrict
Education Period
City
County
Elemen-tary Schools
Middle Schools
Hight Schools
District Ranking in State
Statewide Rank Position Percentile (As Elementary School)
Statewide Rank Position Percentile (As Middle School)
Statewide Rank Position Percentile (As High School)