Education Period
Public 6-8
Address
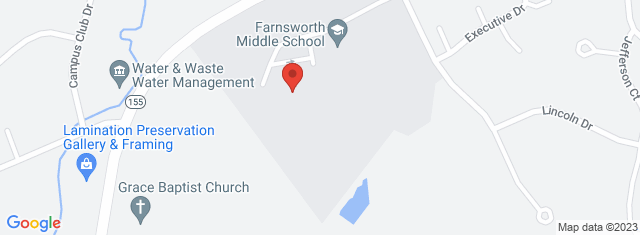
6072 State Farm Rd Guilderland , NY 12084-9534
Overview
Farnsworth Middle School, located in 6072 State Farm Rd Guilderland , NY 12084-9534, serves 1,094 students with a student/teacher ratio of 16.2. It belongs to Guilderland Central School District and ranks 215th of 1,479 New York Middle Schools.
School District
District: Guilderland Central School District
Number of students:
1094
Public School Search
Rank:
215th
215th of 1,479 New York Middle Schools
Per Pupil Expenditure
$15,140
| Student/Teacher Ratio | |
|---|---|
| Student/Teacher Ratio | 16.2 |
| Immunization | |
|---|---|
| Fully immunized: | 95.1% |
| Measles: | 99.4% |
| Polio: | 99.6% |
| Measles: | 99.4% |
| Diphtheria: | 100% |
| Hepatitis B: | 99% |
| Varicella: | 98.9% |
| Racial Breakdown | |
|---|---|
| White: | 70.9% |
| Asian: | 14.6% |
| Hispanic: | 4.8% |
| African American: | 4.8% |
| Two or more races: | 4.2% |
| American Indian: | 0.4% |
| Pacific Islander: | 0.3% |
| Free/Discounted lunch recipients | |
|---|---|
| Free/Discounted lunch recipients | 18.2% |
Performance Trends
Statewide Performance
Average Standard Score
Test Score Average
Average Standard Score
Student Body
Enrollment
Average Standard Score
% Free/Reduced Lunch
Immunization % Complete (Kindergarten)
Teachers
Student/Teacher Ratio
# Full-Time Teachers
Finance
Per Pupil Expenditures
Map and Boundary of Farnsworth Middle School
School Ranking in New York
PublicSchoolSearch ranks 215th of 1,479 New York Middle Schools.
District Ranking in State
PublicSchoolSearch ranks 215th of 1,479 New York Middle Schools.
Average Parent Rating
Historical Ranking of Farnsworth Middle School to other New York Elementary Schools
Statewide Rank Position Percentile
Impact of COVID-19 on Farnsworth Middle School
Rankings
|
Rank Pre-pandemic (2018-2019) |
Rank Pandemic (2020-2021) |
Rank Post-pandemic (2018-2019) |
Change (%) |
|---|---|---|---|
| Ranks 325th of 1439 Middle schools | Ranks 215th of 1479 Middle schools | 8% |
Test Scores
|
% proficient Pre-pandemic (2018-2019) |
% proficient Pandemic (2020-2021) | % proficient Post-pandemic (2021-2022) | Change (%) | |
|---|---|---|---|---|
| 6th Grade English Language Arts (Farnsworth Middle School) | 60 | 71.1 |
11.1% | |
| 6th Grade English Language Arts (Guilderland Central School District) | 60 | 70.7 |
10.7% | |
| 6th Grade English Language Arts (New York) | 47 | 56.6 |
9.6% | |
| 6th Grade Math (Farnsworth Middle School) | 63 | 53.3 |
9.7% | |
| 6th Grade Math (Guilderland Central School District) | 63 | 53 |
10% | |
| 6th Grade Math (New York) | 47 | 38.3 |
8.7% | |
| 7th Grade English Language Arts (Farnsworth Middle School) | 51 | 60 |
9% | |
| 7th Grade English Language Arts (Guilderland Central School District) | 51 | 59.7 |
8.7% | |
| 7th Grade English Language Arts (New York) | 40 | 48 |
8% | |
| 7th Grade Math (Farnsworth Middle School) | 63 | 56.3 |
6.7% | |
| 7th Grade Math (Guilderland Central School District) | 63 | 55.9 |
7.1% | |
| 7th Grade Math (New York) | 44 | 35.3 |
8.7% | |
| 8th Grade English Language Arts (Farnsworth Middle School) | 53 | 64 |
11% | |
| 8th Grade English Language Arts (Guilderland Central School District) | 53 | 63.1 |
10.1% | |
| 8th Grade English Language Arts (New York) | 48 | 49.8 |
1.8% | |
| 8th Grade Math (Farnsworth Middle School) | 36 | 42.2 |
6.2% | |
| 8th Grade Math (Guilderland Central School District) | 36 | 41.6 |
5.6% | |
| 8th Grade Math (New York) | 33 | 23.8 |
9.2% | |
| End of Course Algebra I (Farnsworth Middle School) | 100 | 100 |
0% | |
| End of Course Algebra I (Guilderland Central School District) | 86.3 | 75.1 |
11.2% | |
| End of Course Algebra I (New York) | 71.1 | 66 |
5.2% | |
| End of Course Living Environment (Farnsworth Middle School) | 100 | 100 |
0% | |
| End of Course Living Environment (Guilderland Central School District) | 93.6 | 87.7 |
5.9% | |
| End of Course Living Environment (New York) | 73.2 | 73.9 |
0.7% |
Student Body
|
Number of Students Pre-pandemic (2018-2019) |
Number of Students Pandemic (2020-2021) |
Number of Students Post-pandemic (2021-2022) |
Change (%) | |
|---|---|---|---|---|
| Total Students | 1088 | 1094 |
0.6% |
|
| African American | 44 | 52 |
18.2% |
|
| American Indian | 1 | 4 |
300% |
|
| Asian | 134 | 160 |
19.4% |
|
| Hispanic | 54 | 53 |
1.9% |
|
| Pacific Islander | 2 | 3 |
50% |
|
| White | 813 | 776 |
4.6% |
|
| Two or More Races | 40 | 46 |
15% |
|
| Free/Discounted Lunch Recipients | 20.2 | 18.2 |
2% |