Education Period
Public, Charter, Alternative K-12
Address
1 Corporate Commons-1 Telepor Staten Island , NY 10311-1003
Overview
John W Lavelle Preparatory Charter School, located in 1 Corporate Commons-1 Telepor Staten Island , NY 10311-1003, serves 795 students with a student/teacher ratio of 11.2. It belongs to John W Lavelle Preparatory Charter School and ranks 2063rd of 2,434 New York Alternative Schools.
School District
District: John W Lavelle Preparatory Charter School
Number of students:
795
Public School Search
Rank:
2063rd
2063rd of 2,434 New York Alternative Schools
Per Pupil Expenditure
$20,504
| Student/Teacher Ratio | |
|---|---|
| Student/Teacher Ratio | 11.2 |
| Racial Breakdown | |
|---|---|
| African American: | 43.6% |
| Hispanic: | 43.1% |
| White: | 7.8% |
| Two or more races: | 3.5% |
| Asian: | 1.1% |
| American Indian: | 0.5% |
| Pacific Islander: | 0.3% |
| Free/Discounted lunch recipients | |
|---|---|
| Free/Discounted lunch recipients | 65.5% |
Performance Trends
Statewide Performance
Average Standard Score
Test Score Average
Average Standard Score
Student Body
Enrollment
Average Standard Score
% Free/Reduced Lunch
Immunization % Complete (Kindergarten)
Teachers
Student/Teacher Ratio
# Full-Time Teachers
Finance
Per Pupil Expenditures
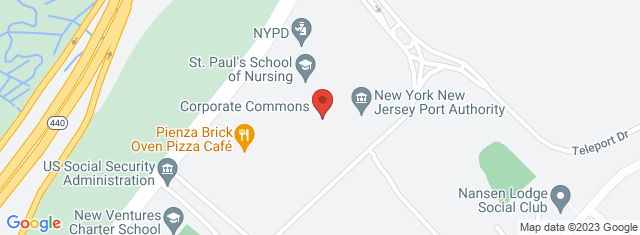
Map and Boundary of John W Lavelle Preparatory Charter School
School Ranking in New York
PublicSchoolSearch ranks 2063rd of 2,434 New York Alternative Schools.
District Ranking in State
PublicSchoolSearch ranks 2063rd of 2,434 New York Alternative Schools.
Average Parent Rating
Historical Ranking of John W Lavelle Preparatory Charter School to other New York Elementary Schools
Statewide Rank Position Percentile
Impact of COVID-19 on John W Lavelle Preparatory Charter School
Rankings
|
Rank Pre-pandemic (2018-2019) |
Rank Pandemic (2020-2021) |
Rank Post-pandemic (2018-2019) |
Change (%) |
|---|---|---|---|
| Ranks 2278th of 2413 Elementary schools | Ranks 2063rd of 2434 Elementary schools | 9.6% | |
| Ranks 1018th of 1439 Middle schools | Ranks 1337th of 1479 Middle schools | 19.7% | |
| Ranks 789th of 1207 High schools | Ranks 688th of 1190 High schools | 7.6% |
Test Scores
|
% proficient Pre-pandemic (2018-2019) |
% proficient Pandemic (2020-2021) | % proficient Post-pandemic (2021-2022) | Change (%) | |
|---|---|---|---|---|
| 3rd Grade English Language Arts (John W Lavelle Preparatory Charter School) | 22 | 28.9 |
6.9% | |
| 3rd Grade English Language Arts (New York) | 52 | 46.3 |
5.7% | |
| 3rd Grade Math (John W Lavelle Preparatory Charter School) | 15 | 31.8 |
16.8% | |
| 3rd Grade Math (New York) | 54 | 47.7 |
6.3% | |
| 4th Grade English Language Arts (John W Lavelle Preparatory Charter School) | 22 | 17 |
5% | |
| 4th Grade English Language Arts (New York) | 48 | 41.5 |
6.5% | |
| 4th Grade Math (John W Lavelle Preparatory Charter School) | 16 | 21.3 |
5.3% | |
| 4th Grade Math (New York) | 50 | 42.9 |
7.1% | |
| 5th Grade English Language Arts (John W Lavelle Preparatory Charter School) | 4 | 16.4 |
12.4% | |
| 5th Grade English Language Arts (New York) | 38 | 37.7 |
0.3% | |
| 5th Grade Math (John W Lavelle Preparatory Charter School) | 14 | 11.5 |
2.5% | |
| 5th Grade Math (New York) | 46 | 36.9 |
9.1% | |
| 6th Grade English Language Arts (John W Lavelle Preparatory Charter School) | 30 | 34.5 |
4.5% | |
| 6th Grade English Language Arts (New York) | 47 | 56.6 |
9.6% | |
| 6th Grade Math (John W Lavelle Preparatory Charter School) | 18 | 7.1 |
10.9% | |
| 6th Grade Math (New York) | 47 | 38.3 |
8.7% | |
| 7th Grade English Language Arts (John W Lavelle Preparatory Charter School) | 27 | 29.3 |
2.3% | |
| 7th Grade English Language Arts (New York) | 40 | 48 |
8% | |
| 7th Grade Math (John W Lavelle Preparatory Charter School) | 33 | 12.8 |
20.2% | |
| 7th Grade Math (New York) | 44 | 35.3 |
8.7% | |
| 8th Grade English Language Arts (John W Lavelle Preparatory Charter School) | 45 | 31.9 |
13.1% | |
| 8th Grade English Language Arts (New York) | 48 | 49.8 |
1.8% | |
| 8th Grade Math (John W Lavelle Preparatory Charter School) | 27 | 1.8 |
25.2% | |
| 8th Grade Math (New York) | 33 | 23.8 |
9.2% | |
| End of Course Algebra I (John W Lavelle Preparatory Charter School) | 64.9 | 63.5 |
1.4% | |
| End of Course Algebra I (New York) | 71.1 | 66 |
5.2% | |
| End of Course Chemistry (John W Lavelle Preparatory Charter School) | 76.6 | 20 |
56.6% | |
| End of Course Chemistry (New York) | 73.1 | 60.4 |
12.7% | |
| End of Course Algebra II (John W Lavelle Preparatory Charter School) | 83.3 | 47.8 |
35.5% | |
| End of Course Algebra II (New York) | 82.7 | 65.5 |
17.2% | |
| End of Course English (John W Lavelle Preparatory Charter School) | 91.3 | 84.4 |
6.9% | |
| End of Course English (New York) | 83.9 | 80.8 |
3% | |
| End of Course Geometry (John W Lavelle Preparatory Charter School) | 67.3 | 25 |
42.3% | |
| End of Course Geometry (New York) | 70.1 | 52.8 |
17.3% | |
| End of Course Earth Science (John W Lavelle Preparatory Charter School) | 26.9 | 4.2 |
22.8% | |
| End of Course Earth Science (New York) | 68.9 | 62.1 |
6.9% | |
| End of Course Living Environment (John W Lavelle Preparatory Charter School) | 71.2 | 72.6 |
1.4% | |
| End of Course Living Environment (New York) | 73.2 | 73.9 |
0.7% |
Student Body
|
Number of Students Pre-pandemic (2018-2019) |
Number of Students Pandemic (2020-2021) |
Number of Students Post-pandemic (2021-2022) |
Change (%) | |
|---|---|---|---|---|
| Total Students | 755 | 795 |
5.3% |
|
| African American | 312 | 347 |
11.2% |
|
| American Indian | 6 | 4 |
33.3% |
|
| Asian | 11 | 9 |
18.2% |
|
| Hispanic | 335 | 343 |
2.4% |
|
| Pacific Islander | 5 | 2 |
60% |
|
| White | 71 | 62 |
12.7% |
|
| Two or More Races | 15 | 28 |
86.7% |
|
| Free/Discounted Lunch Recipients | 58.4 | 65.5 |
7.1% |