Education Period
Public 6-12
Address
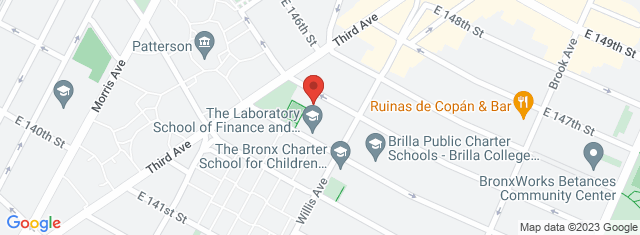
360 E 145th St Bronx , NY 10454
Overview
Laboratory School Of Finance And Technology (The): X223, located in 360 E 145th St Bronx , NY 10454, serves 718 students with a student/teacher ratio of 13.4. It belongs to New York City Geographic District # 7.
School District
District: New York City Geographic District # 7
Number of students:
718
Public School Search
Rank:
Per Pupil Expenditure
$14,121
| Student/Teacher Ratio | |
|---|---|
| Student/Teacher Ratio | 13.4 |
| Immunization | |
|---|---|
| Fully immunized: | 98.8% |
| Racial Breakdown | |
|---|---|
| Hispanic: | 79.8% |
| African American: | 17.1% |
| Asian: | 1% |
| White: | 0.8% |
| American Indian: | 0.6% |
| Two or more races: | 0.4% |
| Pacific Islander: | 0.3% |
| Free/Discounted lunch recipients | |
|---|---|
| Free/Discounted lunch recipients | 95.3% |
Performance Trends
Statewide Performance
Average Standard Score
Test Score Average
Average Standard Score
Student Body
Enrollment
Average Standard Score
% Free/Reduced Lunch
Immunization % Complete (Kindergarten)
Teachers
Student/Teacher Ratio
# Full-Time Teachers
Finance
Per Pupil Expenditures
Map and Boundary of Laboratory School Of Finance And Technology (The): X223
School Ranking in New York
District Ranking in State
Average Parent Rating
Historical Ranking of Laboratory School Of Finance And Technology (The): X223 to other New York Elementary Schools
Statewide Rank Position Percentile
Impact of COVID-19 on Laboratory School Of Finance And Technology (The): X223
Rankings
|
Rank Pre-pandemic (2018-2019) |
Rank Pandemic (2020-2021) |
Rank Post-pandemic (2018-2019) |
Change (%) |
|---|---|---|---|
| Ranks 260th of 1439 Middle schools | Ranks 304th of 1479 Middle schools | 2.5% |
Test Scores
|
% proficient Pre-pandemic (2018-2019) |
% proficient Pandemic (2020-2021) | % proficient Post-pandemic (2021-2022) | Change (%) | |
|---|---|---|---|---|
| 6th Grade English Language Arts (Laboratory School Of Finance And Technology (The): X223) | 67 | 69.1 |
2.1% | |
| 6th Grade English Language Arts (New York City Geographic District # 7) | 28 | 38.6 |
10.6% | |
| 6th Grade English Language Arts (New York) | 47 | 56.6 |
9.6% | |
| 6th Grade Math (Laboratory School Of Finance And Technology (The): X223) | 68 | 22.2 |
45.8% | |
| 6th Grade Math (New York City Geographic District # 7) | 26 | 13.3 |
12.8% | |
| 6th Grade Math (New York) | 47 | 38.3 |
8.7% | |
| 7th Grade English Language Arts (Laboratory School Of Finance And Technology (The): X223) | 51 | 72.6 |
21.6% | |
| 7th Grade English Language Arts (New York City Geographic District # 7) | 22 | 38.5 |
16.5% | |
| 7th Grade English Language Arts (New York) | 40 | 48 |
8% | |
| 7th Grade Math (Laboratory School Of Finance And Technology (The): X223) | 60 | 45.7 |
14.3% | |
| 7th Grade Math (New York City Geographic District # 7) | 20 | 12.8 |
7.2% | |
| 7th Grade Math (New York) | 44 | 35.3 |
8.7% | |
| 8th Grade English Language Arts (Laboratory School Of Finance And Technology (The): X223) | 51 | 64.9 |
13.9% | |
| 8th Grade English Language Arts (New York City Geographic District # 7) | 32 | 36 |
4% | |
| 8th Grade English Language Arts (New York) | 48 | 49.8 |
1.8% | |
| 8th Grade Math (Laboratory School Of Finance And Technology (The): X223) | 51 | 59.1 |
8.1% | |
| 8th Grade Math (New York City Geographic District # 7) | 17 | 14.9 |
2.1% | |
| 8th Grade Math (New York) | 33 | 23.8 |
9.2% | |
| End of Course Algebra I (Laboratory School Of Finance And Technology (The): X223) | 88.5 | 97.3 |
8.8% | |
| End of Course Algebra I (New York City Geographic District # 7) | 46.2 | 36.5 |
9.6% | |
| End of Course Algebra I (New York) | 71.1 | 66 |
5.2% | |
| End of Course English (Laboratory School Of Finance And Technology (The): X223) | 81.4 | 69.7 |
11.8% | |
| End of Course English (New York City Geographic District # 7) | 70.4 | 50.8 |
19.6% | |
| End of Course English (New York) | 83.9 | 80.8 |
3% |
Student Body
|
Number of Students Pre-pandemic (2018-2019) |
Number of Students Pandemic (2020-2021) |
Number of Students Post-pandemic (2021-2022) |
Change (%) | |
|---|---|---|---|---|
| Total Students | 661 | 718 |
8.6% |
|
| African American | 111 | 123 |
10.8% |
|
| American Indian | 2 | 4 |
100% |
|
| Asian | 5 | 7 |
40% |
|
| Hispanic | 536 | 573 |
6.9% |
|
| Pacific Islander | 1 | 2 |
100% |
|
| White | 5 | 6 |
20% |
|
| Two or More Races | 1 | 3 |
200% |
|
| Free/Discounted Lunch Recipients | 95.2 | 95.3 |
0.1% |