School Of Performing Arts, located in 977 Fox St Bronx , NY 10459-3396, serves 305 students with a student/teacher ratio of 9.5. It belongs to New York City Geographic District #12 and ranks 1346th of 1,479 New York Middle Schools.
School District
District: New York City Geographic District #12
Number of students:
305
Public School Search
Rank:
1346th
1346th of 1,479 New York Middle Schools
Per Pupil Expenditure
$22,676
Student/Teacher Ratio
Student/Teacher Ratio
9.5
Immunization
Fully immunized:
90.1%
Racial Breakdown
Hispanic:
55.7%
African American:
37%
Asian:
2.3%
American Indian:
2%
White:
1.6%
Pacific Islander:
0.7%
Two or more races:
0.7%
Free/Discounted lunch recipients
Free/Discounted lunch recipients
96.7%
Performance Trends
Statewide Performance
Average Standard Score
Test Score Average
Average Standard Score
Student Body
Enrollment
Average Standard Score
% Free/Reduced Lunch
Immunization % Complete (Kindergarten)
Teachers
Student/Teacher Ratio
# Full-Time Teachers
Finance
Per Pupil Expenditures
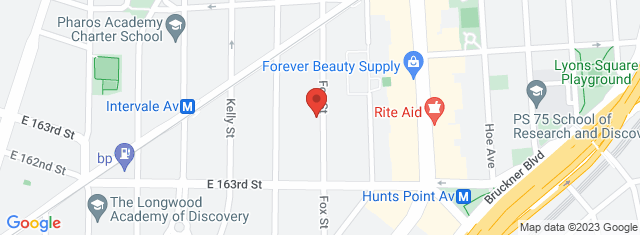
Map and Boundary of School Of Performing Arts
School Ranking in New York
PublicSchoolSearch ranks 1346th of 1,479 New York Middle Schools.
District Ranking in State
PublicSchoolSearch ranks 1346th of 1,479 New York Middle Schools.
Average Parent Rating
Historical Ranking of School Of Performing Arts to other
New York Elementary Schools
Statewide Rank Position Percentile
School Of Performing Arts Test Scores
Historical Enrollment Data
Concerd International School
Impact of COVID-19 on School Of Performing Arts
Rankings
Rank Pre-pandemic (2018-2019)
Rank Pandemic (2020-2021)
Rank Post-pandemic (2018-2019)
Change (%)
Ranks 1341st of 1439 Middle schools
Ranks 1346th of 1479 Middle schools
2.2%
Test Scores
% proficient Pre-pandemic (2018-2019)
% proficient Pandemic (2020-2021)
% proficient Post-pandemic (2021-2022)
Change (%)
6th Grade English Language Arts (School Of Performing Arts)
9
15.3
6.3%
6th Grade English Language Arts (New York City Geographic District #12)
25
32.7
7.7%
6th Grade English Language Arts (New York)
47
56.6
9.6%
6th Grade Math (School Of Performing Arts)
16
2.8
13.2%
6th Grade Math (New York City Geographic District #12)
18
9.5
8.5%
6th Grade Math (New York)
47
38.3
8.7%
7th Grade English Language Arts (School Of Performing Arts)
10
15.5
5.5%
7th Grade English Language Arts (New York City Geographic District #12)
19
28.8
9.8%
7th Grade English Language Arts (New York)
40
48
8%
7th Grade Math (School Of Performing Arts)
11
5.5
5.6%
7th Grade Math (New York City Geographic District #12)
17
11.7
5.3%
7th Grade Math (New York)
44
35.3
8.7%
8th Grade English Language Arts (School Of Performing Arts)
23
32.4
9.3%
8th Grade English Language Arts (New York City Geographic District #12)
29
33.7
4.7%
8th Grade English Language Arts (New York)
48
49.8
1.8%
8th Grade Math (School Of Performing Arts)
24
16.7
7.3%
8th Grade Math (New York City Geographic District #12)
21
16.1
4.9%
8th Grade Math (New York)
33
23.8
9.2%
Student Body
Number of Students Pre-pandemic (2018-2019)
Number of Students Pandemic (2020-2021)
Number of Students Post-pandemic (2021-2022)
Change (%)
Total Students
348
305
12.4%
African American
118
113
4.2%
American Indian
7
6
14.3%
Asian
2
7
250%
Hispanic
212
170
19.8%
Pacific Islander
0
2
0%
White
5
5
0%
Two or More Races
4
2
50%
Free/Discounted Lunch Recipients
88.5
96.7
8.2%
Compare School Of Performing Arts to Nearby Schools
School
Students/Teacher
School
Education Period
Address
District
Number of Students
Student\ Teacher Ratio
Free / discounted lunch recipients %
New York School District Rankings
School Disctrict
Education Period
City
County
Elemen-tary Schools
Middle Schools
Hight Schools
District Ranking in State
Statewide Rank Position Percentile (As Elementary School)
Statewide Rank Position Percentile (As Middle School)
Statewide Rank Position Percentile (As High School)