Education Period
Public 6-12
Address
210 N Broadway Sleepy Hollow , NY 10591-2697
Overview
Sleepy Hollow High School, located in 210 N Broadway Sleepy Hollow , NY 10591-2697, serves 866 students with a student/teacher ratio of 13.0. It belongs to Union Free School District Of The Tarrytowns and ranks 453rd of 1,190 New York High Schools.
School District
District: Union Free School District Of The Tarrytowns
Number of students:
866
Public School Search
Rank:
453rd
453rd of 1,190 New York High Schools
Per Pupil Expenditure
$16,415
| Student/Teacher Ratio | |
|---|---|
| Student/Teacher Ratio | 13 |
| Immunization | |
|---|---|
| Fully immunized: | 89.2% |
| Measles: | 91.9% |
| Polio: | 93.3% |
| Measles: | 91.9% |
| Diphtheria: | 93.5% |
| Hepatitis B: | 92.1% |
| Varicella: | 90.4% |
| Racial Breakdown | |
|---|---|
| Hispanic: | 59.9% |
| White: | 31.1% |
| African American: | 3.5% |
| Two or more races: | 2.9% |
| Asian: | 2.7% |
| Free/Discounted lunch recipients | |
|---|---|
| Free/Discounted lunch recipients | 53.9% |
Performance Trends
Statewide Performance
Average Standard Score
Test Score Average
Average Standard Score
Student Body
Enrollment
Average Standard Score
% Free/Reduced Lunch
Immunization % Complete (Kindergarten)
Teachers
Student/Teacher Ratio
# Full-Time Teachers
Finance
Per Pupil Expenditures
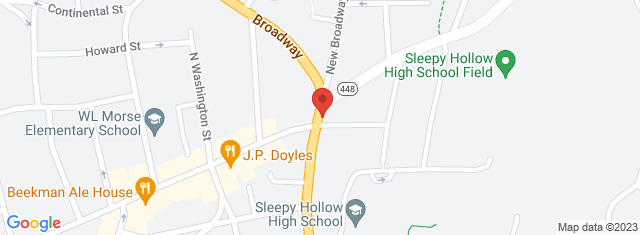
Map and Boundary of Sleepy Hollow High School
School Ranking in New York
PublicSchoolSearch ranks 453rd of 1,190 New York High Schools.
District Ranking in State
PublicSchoolSearch ranks 453rd of 1,190 New York High Schools.
Average Parent Rating
Historical Ranking of Sleepy Hollow High School to other New York Elementary Schools
Statewide Rank Position Percentile
Impact of COVID-19 on Sleepy Hollow High School
Rankings
|
Rank Pre-pandemic (2018-2019) |
Rank Pandemic (2020-2021) |
Rank Post-pandemic (2018-2019) |
Change (%) |
|---|---|---|---|
| Ranks 535th of 1207 High schools | Ranks 453rd of 1190 High schools | 6.3% |
Test Scores
|
% proficient Pre-pandemic (2018-2019) |
% proficient Pandemic (2020-2021) | % proficient Post-pandemic (2021-2022) | Change (%) | |
|---|---|---|---|---|
| End of Course Algebra I (Sleepy Hollow High School) | 88.1 | 81.5 |
6.6% | |
| End of Course Algebra I (Union Free School District Of The Tarrytowns) | 89 | 82.8 |
6.2% | |
| End of Course Algebra I (New York) | 71.1 | 66 |
5.2% | |
| End of Course Chemistry (Sleepy Hollow High School) | 70.5 | 61.8 |
8.6% | |
| End of Course Chemistry (Union Free School District Of The Tarrytowns) | 70.5 | 61.8 |
8.6% | |
| End of Course Chemistry (New York) | 73.1 | 60.4 |
12.7% | |
| End of Course Algebra II (Sleepy Hollow High School) | 90.4 | 71.4 |
19% | |
| End of Course Algebra II (Union Free School District Of The Tarrytowns) | 90.4 | 71.4 |
19% | |
| End of Course Algebra II (New York) | 82.7 | 65.5 |
17.2% | |
| End of Course English (Sleepy Hollow High School) | 88.8 | 84.2 |
4.6% | |
| End of Course English (Union Free School District Of The Tarrytowns) | 88.9 | 84.2 |
4.7% | |
| End of Course English (New York) | 83.9 | 80.8 |
3% | |
| End of Course Geometry (Sleepy Hollow High School) | 90.1 | 61.6 |
28.5% | |
| End of Course Geometry (Union Free School District Of The Tarrytowns) | 90.1 | 61.9 |
28.2% | |
| End of Course Geometry (New York) | 70.1 | 52.8 |
17.3% | |
| End of Course Earth Science (Sleepy Hollow High School) | 68.4 | 57.1 |
11.2% | |
| End of Course Earth Science (Union Free School District Of The Tarrytowns) | 68.1 | 57.1 |
11% | |
| End of Course Earth Science (New York) | 68.9 | 62.1 |
6.9% | |
| End of Course Global History and Geography (Sleepy Hollow High School) | 83.1 | 81.4 |
1.7% | |
| End of Course Global History and Geography (Union Free School District Of The Tarrytowns) | 82.6 | 81.4 |
1.2% | |
| End of Course Global History and Geography (New York) | 78.8 | 79.9 |
1.1% | |
| End of Course Living Environment (Sleepy Hollow High School) | 51.4 | 72.7 |
21.4% | |
| End of Course Living Environment (Union Free School District Of The Tarrytowns) | 75.3 | 66.2 |
9.1% | |
| End of Course Living Environment (New York) | 73.2 | 73.9 |
0.7% | |
| End of Course Physics (Sleepy Hollow High School) | 64.4 | 82.6 |
18.2% | |
| End of Course Physics (Union Free School District Of The Tarrytowns) | 64.4 | 82.6 |
18.2% | |
| End of Course Physics (New York) | 81.6 | 61.8 |
19.8% |
Student Body
|
Number of Students Pre-pandemic (2018-2019) |
Number of Students Pandemic (2020-2021) |
Number of Students Post-pandemic (2021-2022) |
Change (%) | |
|---|---|---|---|---|
| Total Students | 850 | 866 |
1.9% |
|
| African American | 36 | 30 |
16.7% |
|
| American Indian | 0 | 0 | 0% | |
| Asian | 18 | 23 |
27.8% |
|
| Hispanic | 491 | 519 |
5.7% |
|
| Pacific Islander | 0 | 0 | 0% | |
| White | 285 | 269 |
5.6% |
|
| Two or More Races | 20 | 25 |
25% |
|
| Free/Discounted Lunch Recipients | 53.3 | 53.9 |
0.6% |