Mt. Hope High School, located in 199 Chestnut Street Bristol , RI 02809, serves 980 students with a student/teacher ratio of 14.8. It belongs to Bristol Warren and ranks 14th of 59 Rhode Island High Schools.
School District
District: Bristol Warren
Number of students:
980
Public School Search
Rank:
14th
14th of 59 Rhode Island High Schools
Per Pupil Expenditure
$15,287
Student/Teacher Ratio
Student/Teacher Ratio
14.8
Racial Breakdown
White:
86.8%
Hispanic:
5.1%
Two or more races:
4.1%
African American:
2.1%
Asian:
1.5%
American Indian:
0.3%
Free/Discounted lunch recipients
Free/Discounted lunch recipients
30%
Performance Trends
Statewide Performance
Average Standard Score
Test Score Average
Average Standard Score
Student Body
Enrollment
Average Standard Score
% Free/Reduced Lunch
Immunization % Complete (Kindergarten)
Teachers
Student/Teacher Ratio
# Full-Time Teachers
Finance
Per Pupil Expenditures
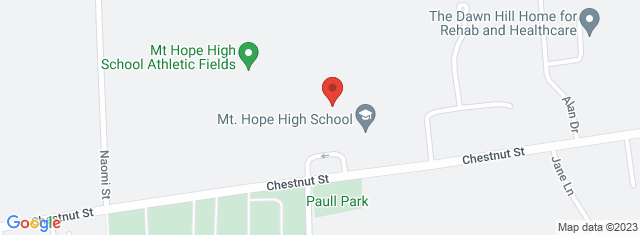
Map and Boundary of Mt. Hope High School
School Ranking in Rhode Island
PublicSchoolSearch ranks 14th of 59 Rhode Island High Schools.
District Ranking in State
PublicSchoolSearch ranks 14th of 59 Rhode Island High Schools.
Average Parent Rating
Historical Ranking of Mt. Hope High School to other
Rhode Island Elementary Schools
Statewide Rank Position Percentile
Mt. Hope High School Test Scores
Historical Enrollment Data
Concerd International School
Impact of COVID-19 on Mt. Hope High School
Rankings
Rank Pre-pandemic (2018-2019)
Rank Pandemic (2020-2021)
Rank Post-pandemic (2018-2019)
Change (%)
Ranks 14th of 59 High schools
Ranks 14th of 59 High schools
0%
Test Scores
% proficient Pre-pandemic (2018-2019)
% proficient Pandemic (2020-2021)
% proficient Post-pandemic (2021-2022)
Change (%)
10th Grade English Language Arts (Mt. Hope High School)
72.1
72
0.1%
10th Grade English Language Arts (Bristol Warren)
71.6
72.4
0.8%
10th Grade English Language Arts (Rhode Island)
60.1
59.2
0.9%
10th Grade Mathematics (Mt. Hope High School)
37.9
38.1
0.2%
10th Grade Mathematics (Bristol Warren)
37.8
38.1
0.3%
10th Grade Mathematics (Rhode Island)
31
29.2
1.8%
11th Grade English Language Arts (Mt. Hope High School)
68.8
72.3
3.5%
11th Grade English Language Arts (Bristol Warren)
67.5
71.6
4.1%
11th Grade English Language Arts (Rhode Island)
50.5
47.1
3.4%
11th Grade Mathematics (Mt. Hope High School)
40.7
28.3
12.4%
11th Grade Mathematics (Bristol Warren)
39.9
28
11.9%
11th Grade Mathematics (Rhode Island)
31.2
25.3
5.9%
Student Body
Number of Students Pre-pandemic (2018-2019)
Number of Students Pandemic (2020-2021)
Number of Students Post-pandemic (2021-2022)
Change (%)
Total Students
944
980
3.8%
African American
27
21
22.2%
American Indian
6
3
50%
Asian
13
15
15.4%
Hispanic
41
50
22%
Pacific Islander
0
0
0%
White
822
851
3.5%
Two or More Races
35
40
14.3%
Free/Discounted Lunch Recipients
26.9
30
3.1%
Compare Mt. Hope High School to Nearby Schools
School
Students/Teacher
School
Education Period
Address
District
Number of Students
Student\ Teacher Ratio
Free / discounted lunch recipients %
Rhode Island School District Rankings
School Disctrict
Education Period
City
County
Elemen-tary Schools
Middle Schools
Hight Schools
District Ranking in State
Statewide Rank Position Percentile (As Elementary School)
Statewide Rank Position Percentile (As Middle School)
Statewide Rank Position Percentile (As High School)