Education Period
Public PK, KG-8
Address
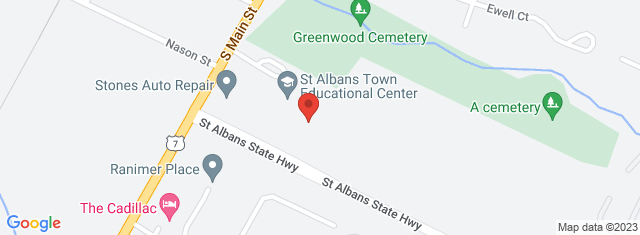
169 South Main Street Saint Albans , VT 05478-1898
Overview
St. Albans Town Educational Center, located in 169 South Main Street Saint Albans , VT 05478-1898, serves 741 students with a student/teacher ratio of 14.5. It belongs to Maple Run Unified School District and ranks 77th of 148 Vermont Elementary Schools.
School District
District: Maple Run Unified School District
Number of students:
741
Public School Search
Rank:
77th
77th of 148 Vermont Elementary Schools
Per Pupil Expenditure
$11,303
| Student/Teacher Ratio | |
|---|---|
| Student/Teacher Ratio | 14.5 |
| Racial Breakdown | |
|---|---|
| White: | 88.7% |
| Two or more races: | 7.7% |
| Hispanic: | 2.6% |
| Asian: | 0.7% |
| African American: | 0.4% |
| Free/Discounted lunch recipients | |
|---|---|
| Free/Discounted lunch recipients | 29% |
Performance Trends
Statewide Performance
Average Standard Score
Test Score Average
Average Standard Score
Student Body
Enrollment
Average Standard Score
% Free/Reduced Lunch
Immunization % Complete (Kindergarten)
Teachers
Student/Teacher Ratio
# Full-Time Teachers
Finance
Per Pupil Expenditures
Map and Boundary of St. Albans Town Educational Center
School Ranking in Vermont
PublicSchoolSearch ranks 77th of 148 Vermont Elementary Schools.
District Ranking in State
PublicSchoolSearch ranks 77th of 148 Vermont Elementary Schools.
Average Parent Rating
Historical Ranking of St. Albans Town Educational Center to other Vermont Elementary Schools
Statewide Rank Position Percentile
Impact of COVID-19 on St. Albans Town Educational Center
Rankings
|
Rank Pre-pandemic (2018-2019) |
Rank Pandemic (2020-2021) |
Rank Post-pandemic (2018-2019) |
Change (%) |
|---|---|---|---|
| Ranks 79th of 138 Elementary schools | Ranks 77th of 148 Elementary schools | 5.2% | |
| Ranks 40th of 89 Middle schools | Ranks 43rd of 85 Middle schools | 5.6% |
Test Scores
|
% proficient Pre-pandemic (2018-2019) |
% proficient Pandemic (2020-2021) | % proficient Post-pandemic (2021-2022) | Change (%) | |
|---|---|---|---|---|
| 3rd Grade English Language Arts (St. Albans Town Educational Center) | 44.5 |
13.1% | ||
| 3rd Grade English Language Arts (Vermont) | 49.5 |
7% | ||
| 3rd Grade Mathematics (St. Albans Town Educational Center) | 44.5 |
14.5% | ||
| 3rd Grade Mathematics (Vermont) | 52.5 |
11.1% | ||
| 4th Grade English Language Arts (St. Albans Town Educational Center) | 52 |
3% | ||
| 4th Grade English Language Arts (Vermont) | 50.6 |
5.9% | ||
| 4th Grade Mathematics (St. Albans Town Educational Center) | 42.1 |
17.3% | ||
| 4th Grade Mathematics (Vermont) | 46.5 |
9.1% | ||
| 5th Grade Science (St. Albans Town Educational Center) | 43.4 |
8.3% | ||
| 5th Grade Science (Vermont) | 37.2 |
2.1% | ||
| 5th Grade English Language Arts (St. Albans Town Educational Center) | 60.5 |
6.5% | ||
| 5th Grade English Language Arts (Vermont) | 55.5 |
6.1% | ||
| 5th Grade Mathematics (St. Albans Town Educational Center) | 40.7 |
7% | ||
| 5th Grade Mathematics (Vermont) | 41.7 |
10.8% | ||
| 6th Grade English Language Arts (St. Albans Town Educational Center) | 44.5 |
8.2% | ||
| 6th Grade English Language Arts (Vermont) | 52.7 |
9% | ||
| 6th Grade Mathematics (St. Albans Town Educational Center) | 34.9 |
24.6% | ||
| 6th Grade Mathematics (Vermont) | 38.5 |
11% | ||
| 7th Grade English Language Arts (St. Albans Town Educational Center) | 60.8 |
6.8% | ||
| 7th Grade English Language Arts (Vermont) | 56.2 |
4.8% | ||
| 7th Grade Mathematics (St. Albans Town Educational Center) | 43.4 |
5.6% | ||
| 7th Grade Mathematics (Vermont) | 43.3 |
10.6% | ||
| 8th Grade Science (St. Albans Town Educational Center) | 34.6 |
1.2% | ||
| 8th Grade Science (Vermont) | 39 |
4.3% | ||
| 8th Grade English Language Arts (St. Albans Town Educational Center) | 55.1 |
11% | ||
| 8th Grade English Language Arts (Vermont) | 52.9 |
1.4% | ||
| 8th Grade Mathematics (St. Albans Town Educational Center) | 50 |
15% | ||
| 8th Grade Mathematics (Vermont) | 40 |
8.1% |
Student Body
|
Number of Students Pre-pandemic (2018-2019) |
Number of Students Pandemic (2020-2021) |
Number of Students Post-pandemic (2021-2022) |
Change (%) | |
|---|---|---|---|---|
| Total Students | 813 | 741 |
8.9% |
|
| African American | 1 | 3 |
200% |
|
| American Indian | 0 | 0 | 0% | |
| Asian | 4 | 5 |
25% |
|
| Hispanic | 16 | 19 |
18.8% |
|
| Pacific Islander | 0 | 0 | 0% | |
| White | 792 | 657 |
17% |
|
| Two or More Races | 0 | 57 | 0% | |
| Free/Discounted Lunch Recipients | 26.1 | 29 |
2.9% |