Apple Pie Ridge Elementary, located in 349 Apple Pie Ridge Rd Winchester , VA 22603, serves 433 students with a student/teacher ratio of 12.9. It belongs to Frederick County Public Schools and ranks 849th of 1,109 Virginia Elementary Schools.
School District
District: Frederick County Public Schools
Number of students:
433
Public School Search
Rank:
849th
849th of 1,109 Virginia Elementary Schools
Per Pupil Expenditure
$9,365
Student/Teacher Ratio
Student/Teacher Ratio
12.9
Racial Breakdown
White:
61.7%
Hispanic:
29.1%
Two or more races:
4.2%
African American:
3.5%
Asian:
1.2%
American Indian:
0.5%
Free/Discounted lunch recipients
Free/Discounted lunch recipients
42.6%
Performance Trends
Statewide Performance
Average Standard Score
Test Score Average
Average Standard Score
Student Body
Enrollment
Average Standard Score
% Free/Reduced Lunch
Immunization % Complete (Kindergarten)
Teachers
Student/Teacher Ratio
# Full-Time Teachers
Finance
Per Pupil Expenditures
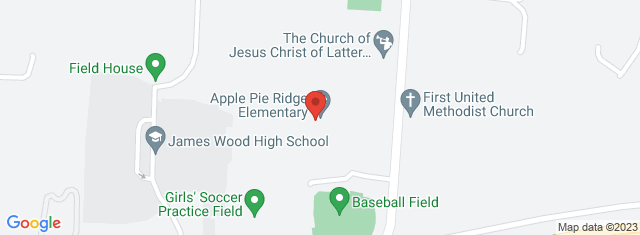
Map and Boundary of Apple Pie Ridge Elementary
School Ranking in Virginia
PublicSchoolSearch ranks 849th of 1,109 Virginia Elementary Schools.
District Ranking in State
PublicSchoolSearch ranks 849th of 1,109 Virginia Elementary Schools.
Average Parent Rating
Historical Ranking of Apple Pie Ridge Elementary to other
Virginia Elementary Schools
Statewide Rank Position Percentile
Apple Pie Ridge Elementary Test Scores
Historical Enrollment Data
Concerd International School
Impact of COVID-19 on Apple Pie Ridge Elementary
Rankings
Rank Pre-pandemic (2018-2019)
Rank Pandemic (2020-2021)
Rank Post-pandemic (2018-2019)
Change (%)
Ranks 651st of 1105 Elementary schools
Ranks 849th of 1109 Elementary schools
17.6%
Test Scores
% proficient Pre-pandemic (2018-2019)
% proficient Pandemic (2020-2021)
% proficient Post-pandemic (2021-2022)
Change (%)
3rd Grade Mathematics (Apple Pie Ridge Elementary)
80
47
33%
3rd Grade Mathematics (Frederick County Public Schools)
79
63
16%
3rd Grade Mathematics (Virginia)
82
67
15%
3rd Grade English Reading (Apple Pie Ridge Elementary)
72
59
13%
3rd Grade English Reading (Frederick County Public Schools)
67
65
2%
3rd Grade English Reading (Virginia)
71
68
3%
4th Grade Mathematics (Apple Pie Ridge Elementary)
83
55
28%
4th Grade Mathematics (Frederick County Public Schools)
80
58
22%
4th Grade Mathematics (Virginia)
83
66
17%
4th Grade English Reading (Apple Pie Ridge Elementary)
71
59
12%
4th Grade English Reading (Frederick County Public Schools)
70
67
3%
4th Grade English Reading (Virginia)
75
72
3%
5th Grade Mathematics (Apple Pie Ridge Elementary)
83
53
30%
5th Grade Mathematics (Frederick County Public Schools)
76
57
19%
5th Grade Mathematics (Virginia)
81
64
17%
5th Grade Science (Apple Pie Ridge Elementary)
83
53
30%
5th Grade Science (Frederick County Public Schools)
74
56
18%
5th Grade Science (Virginia)
79
61
18%
5th Grade English Reading (Apple Pie Ridge Elementary)
75
69
6%
5th Grade English Reading (Frederick County Public Schools)
73
65
8%
5th Grade English Reading (Virginia)
78
72
6%
Student Body
Number of Students Pre-pandemic (2018-2019)
Number of Students Pandemic (2020-2021)
Number of Students Post-pandemic (2021-2022)
Change (%)
Total Students
456
433
5%
African American
12
15
25%
American Indian
2
2
0%
Asian
4
5
25%
Hispanic
112
126
12.5%
Pacific Islander
0
0
0%
White
311
267
14.1%
Two or More Races
15
18
20%
Compare Apple Pie Ridge Elementary to Nearby Schools
School
Students/Teacher
School
Education Period
Address
District
Number of Students
Student\ Teacher Ratio
Free / discounted lunch recipients %
Virginia School District Rankings
School Disctrict
Education Period
City
County
Elemen-tary Schools
Middle Schools
Hight Schools
District Ranking in State
Statewide Rank Position Percentile (As Elementary School)
Statewide Rank Position Percentile (As Middle School)
Statewide Rank Position Percentile (As High School)