Education Period
Public 5-8
Address
206 Slagles Lake Rd Emporia , VA 23847-8007
Overview
Edward W Wyatt Middle, located in 206 Slagles Lake Rd Emporia , VA 23847-8007, serves 533 students with a student/teacher ratio of 11.2. It belongs to Greensville County Public Schools and ranks 379th of 415 Virginia Middle Schools.
School District
District: Greensville County Public Schools
Number of students:
533
Public School Search
Rank:
379th
379th of 415 Virginia Middle Schools
Per Pupil Expenditure
$8,578
| Student/Teacher Ratio | |
|---|---|
| Student/Teacher Ratio | 11.2 |
| Racial Breakdown | |
|---|---|
| African American: | 76.2% |
| White: | 15% |
| Hispanic: | 5.3% |
| Two or more races: | 2.3% |
| Asian: | 1.3% |
| Free/Discounted lunch recipients | |
|---|---|
| Free/Discounted lunch recipients | 98.7% |
Performance Trends
Statewide Performance
Average Standard Score
Test Score Average
Average Standard Score
Student Body
Enrollment
Average Standard Score
% Free/Reduced Lunch
Immunization % Complete (Kindergarten)
Teachers
Student/Teacher Ratio
# Full-Time Teachers
Finance
Per Pupil Expenditures
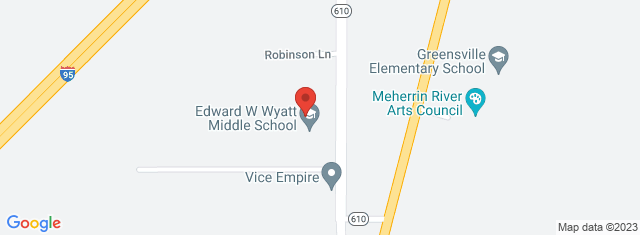
Map and Boundary of Edward W Wyatt Middle
School Ranking in Virginia
PublicSchoolSearch ranks 379th of 415 Virginia Middle Schools.
District Ranking in State
PublicSchoolSearch ranks 379th of 415 Virginia Middle Schools.
Average Parent Rating
Historical Ranking of Edward W Wyatt Middle to other Virginia Elementary Schools
Statewide Rank Position Percentile
Impact of COVID-19 on Edward W Wyatt Middle
Rankings
|
Rank Pre-pandemic (2018-2019) |
Rank Pandemic (2020-2021) |
Rank Post-pandemic (2018-2019) |
Change (%) |
|---|---|---|---|
| Ranks 412th of 424 Middle schools | Ranks 379th of 415 Middle schools | 5.8% |
Test Scores
|
% proficient Pre-pandemic (2018-2019) |
% proficient Pandemic (2020-2021) | % proficient Post-pandemic (2021-2022) | Change (%) | |
|---|---|---|---|---|
| 6th Grade Mathematics (Edward W Wyatt Middle) | 62 | 54 |
8% | |
| 6th Grade Mathematics (Greensville County Public Schools) | 61 | 54 |
7% | |
| 6th Grade Mathematics (Virginia) | 78 | 57 |
21% | |
| 6th Grade English Reading (Edward W Wyatt Middle) | 52 | 58 |
6% | |
| 6th Grade English Reading (Greensville County Public Schools) | 52 | 58 |
6% | |
| 6th Grade English Reading (Virginia) | 77 | 70 |
7% | |
| 7th Grade Mathematics (Edward W Wyatt Middle) | 21 | 40 |
19% | |
| 7th Grade Mathematics (Greensville County Public Schools) | 21 | 40 |
19% | |
| 7th Grade Mathematics (Virginia) | 78 | 55 |
23% | |
| 7th Grade English Reading (Edward W Wyatt Middle) | 65 | 54 |
11% | |
| 7th Grade English Reading (Greensville County Public Schools) | 65 | 54 |
11% | |
| 7th Grade English Reading (Virginia) | 79 | 72 |
7% | |
| 8th Grade Writing (Edward W Wyatt Middle) | 39 | 21 |
18% | |
| 8th Grade Writing (Greensville County Public Schools) | 38 | 21 |
17% | |
| 8th Grade Writing (Virginia) | 70 | 57 |
13% | |
| 8th Grade Mathematics (Edward W Wyatt Middle) | 63 | 31 |
32% | |
| 8th Grade Mathematics (Greensville County Public Schools) | 63 | 31 |
32% | |
| 8th Grade Mathematics (Virginia) | 77 | 57 |
20% | |
| 8th Grade Science (Edward W Wyatt Middle) | 61 | 43 |
18% | |
| 8th Grade Science (Greensville County Public Schools) | 61 | 43 |
18% | |
| 8th Grade Science (Virginia) | 78 | 61 |
17% | |
| 8th Grade English Reading (Edward W Wyatt Middle) | 58 | 47 |
11% | |
| 8th Grade English Reading (Greensville County Public Schools) | 58 | 46 |
12% | |
| 8th Grade English Reading (Virginia) | 76 | 72 |
4% | |
| End of Course Algebra I (Edward W Wyatt Middle) | 95 | 96 |
1% | |
| End of Course Algebra I (Greensville County Public Schools) | 77 | 79 |
2% | |
| End of Course Algebra I (Virginia) | 86 | 80 |
6% |
Student Body
|
Number of Students Pre-pandemic (2018-2019) |
Number of Students Pandemic (2020-2021) |
Number of Students Post-pandemic (2021-2022) |
Change (%) | |
|---|---|---|---|---|
| Total Students | 480 | 533 |
11% |
|
| African American | 363 | 406 |
11.8% |
|
| American Indian | 0 | 0 | 0% | |
| Asian | 3 | 7 |
133.3% |
|
| Hispanic | 12 | 28 |
133.3% |
|
| Pacific Islander | 0 | 0 | 0% | |
| White | 90 | 80 |
11.1% |
|
| Two or More Races | 12 | 12 | 0% |