Education Period
Public PK, KG-6
Address
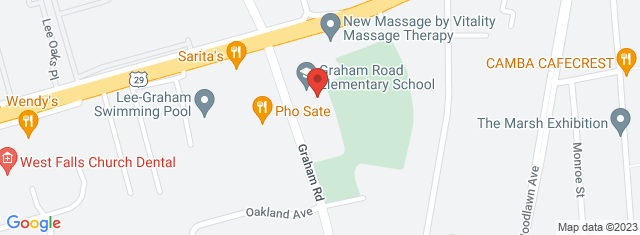
2831 Graham Rd Falls Church , VA 22042
Overview
Graham Road Elementary, located in 2831 Graham Rd Falls Church , VA 22042, serves 397 students with a student/teacher ratio of 11.4. It belongs to Fairfax County Public Schools and ranks 865th of 1,109 Virginia Elementary Schools.
School District
District: Fairfax County Public Schools
Number of students:
397
Public School Search
Rank:
865th
865th of 1,109 Virginia Elementary Schools
Per Pupil Expenditure
$11,553
| Student/Teacher Ratio | |
|---|---|
| Student/Teacher Ratio | 11.4 |
| Racial Breakdown | |
|---|---|
| Hispanic: | 82.4% |
| White: | 7.6% |
| African American: | 6% |
| Asian: | 2.3% |
| Two or more races: | 1.3% |
| American Indian: | 0.5% |
| Free/Discounted lunch recipients | |
|---|---|
| Free/Discounted lunch recipients | 82.7% |
Performance Trends
Statewide Performance
Average Standard Score
Test Score Average
Average Standard Score
Student Body
Enrollment
Average Standard Score
% Free/Reduced Lunch
Immunization % Complete (Kindergarten)
Teachers
Student/Teacher Ratio
# Full-Time Teachers
Finance
Per Pupil Expenditures
Map and Boundary of Graham Road Elementary
School Ranking in Virginia
PublicSchoolSearch ranks 865th of 1,109 Virginia Elementary Schools.
District Ranking in State
PublicSchoolSearch ranks 865th of 1,109 Virginia Elementary Schools.
Average Parent Rating
Historical Ranking of Graham Road Elementary to other Virginia Elementary Schools
Statewide Rank Position Percentile
Impact of COVID-19 on Graham Road Elementary
Rankings
|
Rank Pre-pandemic (2018-2019) |
Rank Pandemic (2020-2021) |
Rank Post-pandemic (2018-2019) |
Change (%) |
|---|---|---|---|
| Ranks 1029th of 1105 Elementary schools | Ranks 865th of 1109 Elementary schools | 15.1% |
Test Scores
|
% proficient Pre-pandemic (2018-2019) |
% proficient Pandemic (2020-2021) | % proficient Post-pandemic (2021-2022) | Change (%) | |
|---|---|---|---|---|
| 3rd Grade Mathematics (Graham Road Elementary) | 65 | 38 |
27% | |
| 3rd Grade Mathematics (Fairfax County Public Schools) | 85 | 71 |
14% | |
| 3rd Grade Mathematics (Virginia) | 82 | 67 |
15% | |
| 3rd Grade English Reading (Graham Road Elementary) | 37 | 44 |
7% | |
| 3rd Grade English Reading (Fairfax County Public Schools) | 72 | 72 |
0% | |
| 3rd Grade English Reading (Virginia) | 71 | 68 |
3% | |
| 4th Grade Mathematics (Graham Road Elementary) | 65 | 35 |
30% | |
| 4th Grade Mathematics (Fairfax County Public Schools) | 86 | 72 |
14% | |
| 4th Grade Mathematics (Virginia) | 83 | 66 |
17% | |
| 4th Grade English Reading (Graham Road Elementary) | 60 | 44 |
16% | |
| 4th Grade English Reading (Fairfax County Public Schools) | 77 | 77 |
0% | |
| 4th Grade English Reading (Virginia) | 75 | 72 |
3% | |
| 5th Grade Mathematics (Graham Road Elementary) | 67 | 69 |
2% | |
| 5th Grade Mathematics (Fairfax County Public Schools) | 77 | 61 |
16% | |
| 5th Grade Mathematics (Virginia) | 81 | 64 |
17% | |
| 5th Grade Science (Graham Road Elementary) | 63 | 72 |
9% | |
| 5th Grade Science (Fairfax County Public Schools) | 81 | 67 |
14% | |
| 5th Grade Science (Virginia) | 79 | 61 |
18% | |
| 5th Grade English Reading (Graham Road Elementary) | 64 | 79 |
15% | |
| 5th Grade English Reading (Fairfax County Public Schools) | 80 | 77 |
3% | |
| 5th Grade English Reading (Virginia) | 78 | 72 |
6% | |
| 6th Grade Mathematics (Graham Road Elementary) | 79 | 41 |
38% | |
| 6th Grade Mathematics (Fairfax County Public Schools) | 87 | 75 |
12% | |
| 6th Grade Mathematics (Virginia) | 78 | 57 |
21% | |
| 6th Grade English Reading (Graham Road Elementary) | 67 | 44 |
23% | |
| 6th Grade English Reading (Fairfax County Public Schools) | 83 | 81 |
2% | |
| 6th Grade English Reading (Virginia) | 77 | 70 |
7% | |
| 7th Grade Mathematics (Graham Road Elementary) | 100 | 100 |
0% | |
| 7th Grade Mathematics (Fairfax County Public Schools) | 86 | 69 |
17% | |
| 7th Grade Mathematics (Virginia) | 78 | 55 |
23% |
Student Body
|
Number of Students Pre-pandemic (2018-2019) |
Number of Students Pandemic (2020-2021) |
Number of Students Post-pandemic (2021-2022) |
Change (%) | |
|---|---|---|---|---|
| Total Students | 432 | 397 |
8.1% |
|
| African American | 46 | 24 |
47.8% |
|
| American Indian | 2 | 2 | 0% | |
| Asian | 14 | 9 |
35.7% |
|
| Hispanic | 338 | 327 |
3.3% |
|
| Pacific Islander | 0 | 0 | 0% | |
| White | 29 | 30 |
3.4% |
|
| Two or More Races | 3 | 5 |
66.7% |