Mabscott Elementary, located in 104 Pershing Street Mabscott , WV 25871, serves 256 students with a student/teacher ratio of 12.1. It belongs to Raleigh County Schools and ranks 292nd of 375 West Virginia Elementary Schools.
School District
District: Raleigh County Schools
Number of students:
256
Public School Search
Rank:
292nd
292nd of 375 West Virginia Elementary Schools
Per Pupil Expenditure
$12,284
Student/Teacher Ratio
Student/Teacher Ratio
12.1
Racial Breakdown
White:
69.1%
African American:
16.8%
Two or more races:
12.1%
Hispanic:
2%
Free/Discounted lunch recipients
Free/Discounted lunch recipients
75.3%
Performance Trends
Statewide Performance
Average Standard Score
Test Score Average
Average Standard Score
Student Body
Enrollment
Average Standard Score
% Free/Reduced Lunch
Immunization % Complete (Kindergarten)
Teachers
Student/Teacher Ratio
# Full-Time Teachers
Finance
Per Pupil Expenditures
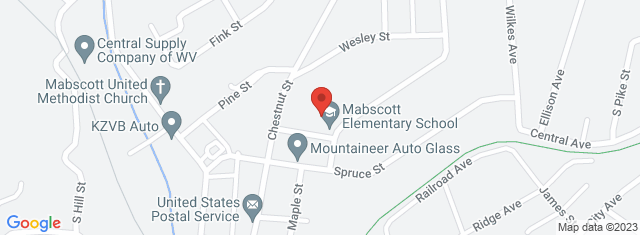
Map and Boundary of Mabscott Elementary
School Ranking in West Virginia
PublicSchoolSearch ranks 292nd of 375 West Virginia Elementary Schools.
District Ranking in State
PublicSchoolSearch ranks 292nd of 375 West Virginia Elementary Schools.
Average Parent Rating
Historical Ranking of Mabscott Elementary to other
West Virginia Elementary Schools
Statewide Rank Position Percentile
Mabscott Elementary Test Scores
Historical Enrollment Data
Concerd International School
Impact of COVID-19 on Mabscott Elementary
Rankings
Rank Pre-pandemic (2018-2019)
Rank Pandemic (2020-2021)
Rank Post-pandemic (2018-2019)
Change (%)
Ranks 327th of 383 Elementary schools
Ranks 292nd of 375 Elementary schools
7.5%
Test Scores
% proficient Pre-pandemic (2018-2019)
% proficient Pandemic (2020-2021)
% proficient Post-pandemic (2021-2022)
Change (%)
3rd Grade Mathematics (Mabscott Elementary)
29.7
25.9
3.8%
3rd Grade Mathematics (Raleigh County Schools)
49
49.7
0.8%
3rd Grade Mathematics (West Virginia)
50.9
46.1
4.8%
3rd Grade English Language Arts (Mabscott Elementary)
29.7
25.9
3.8%
3rd Grade English Language Arts (Raleigh County Schools)
44
40.1
3.9%
3rd Grade English Language Arts (West Virginia)
44
36.2
7.8%
4th Grade Mathematics (Mabscott Elementary)
34.3
31.4
2.9%
4th Grade Mathematics (Raleigh County Schools)
39.1
44
4.9%
4th Grade Mathematics (West Virginia)
47.3
41.9
5.4%
4th Grade English Language Arts (Mabscott Elementary)
40
28.6
11.4%
4th Grade English Language Arts (Raleigh County Schools)
47.3
46.5
0.8%
4th Grade English Language Arts (West Virginia)
48.8
43.7
5.1%
5th Grade Mathematics (Mabscott Elementary)
48.5
40.5
7.9%
5th Grade Mathematics (Raleigh County Schools)
42.5
37.2
5.3%
5th Grade Mathematics (West Virginia)
40
34.9
5.1%
5th Grade English Language Arts (Mabscott Elementary)
33.3
35.1
1.8%
5th Grade English Language Arts (Raleigh County Schools)
50.7
45
5.7%
5th Grade English Language Arts (West Virginia)
47.2
41.2
6%
5th Grade Science (Mabscott Elementary)
18.2
21.6
3.4%
5th Grade Science (Raleigh County Schools)
35.4
29.2
6.2%
5th Grade Science (West Virginia)
35.4
30.3
5.2%
Student Body
Number of Students Pre-pandemic (2018-2019)
Number of Students Pandemic (2020-2021)
Number of Students Post-pandemic (2021-2022)
Change (%)
Total Students
264
256
3%
African American
36
43
19.4%
American Indian
1
0
100%
Asian
0
0
0%
Hispanic
3
5
66.7%
Pacific Islander
0
0
0%
White
197
177
10.2%
Two or More Races
27
31
14.8%
Compare Mabscott Elementary to Nearby Schools
School
Students/Teacher
School
Education Period
Address
District
Number of Students
Student\ Teacher Ratio
Free / discounted lunch recipients %
West Virginia School District Rankings
School Disctrict
Education Period
City
County
Elemen-tary Schools
Middle Schools
Hight Schools
District Ranking in State
Statewide Rank Position Percentile (As Elementary School)
Statewide Rank Position Percentile (As Middle School)
Statewide Rank Position Percentile (As High School)